BTC, ETH and SOL Face Critical Resistance: $105.5k, $2,420, $144 Levels
Markets are pivoting hard: Middle East tensions ease, the Fed prepares for cuts, crypto majors run straight into key resistance. Oil drops, risk asset bulls hesitate—are we at a turning point or just another bull trap?
Ceasefire deals and dovish signals are shaking up price action across the board. While bullish relief rallies are tempting, every major crypto is stalling below tough resistance. Will this week’s moves set the trend for months ahead, or will geopolitical risks snap right back?
• Oil drops as Middle East tensions cool, inflation fears ease and risk assets rebound
• September or October Fed cut favoured, all eyes on Friday’s PCE data for next market cue
• BTC ($105,500), ETH ($2,420) & SOL ($144) hit resistance, consolidation expected after rally
• ETF inflows resume for Bitcoin, signalling growing institutional appetite as volatility fades
• Israel-Iran ceasefire and market relief
• Fed’s dovish signals and rate cut probabilities
• Crypto majors (BTC, ETH, SOL, HYPE) resistance zones
• ETF inflows and their market significance
• Strategic positioning and our take for Q3/Q4 2025
Disclaimer: This is not financial or investment advice. You are responsible for any capital-related decisions you make, and only you are accountable for the results.
Middle East tensions ease—will risk rally last?
From open warfare to diplomatic manoeuvres, the Middle East story just flipped. Iran’s calculated missile strikes and the US response sparked major short-term volatility, but market participants are now pricing in a real ceasefire. Oil’s sharp drop confirms that traders are moving past crisis mode, while US diplomatic pressure mounts on both Israel and Iran to step back from the brink.
Monday’s ceasefire unwound risk hedges, sending oil prices sharply lower and breathing new life into equities and crypto. But small-scale resumed hostilities—missiles on Israel and retaliatory strikes—prove this isn’t over yet. Still, markets sense the worst is past for now, and that’s keeping bulls alert for capital rotation into risk assets.
Oil 1D timeframe:
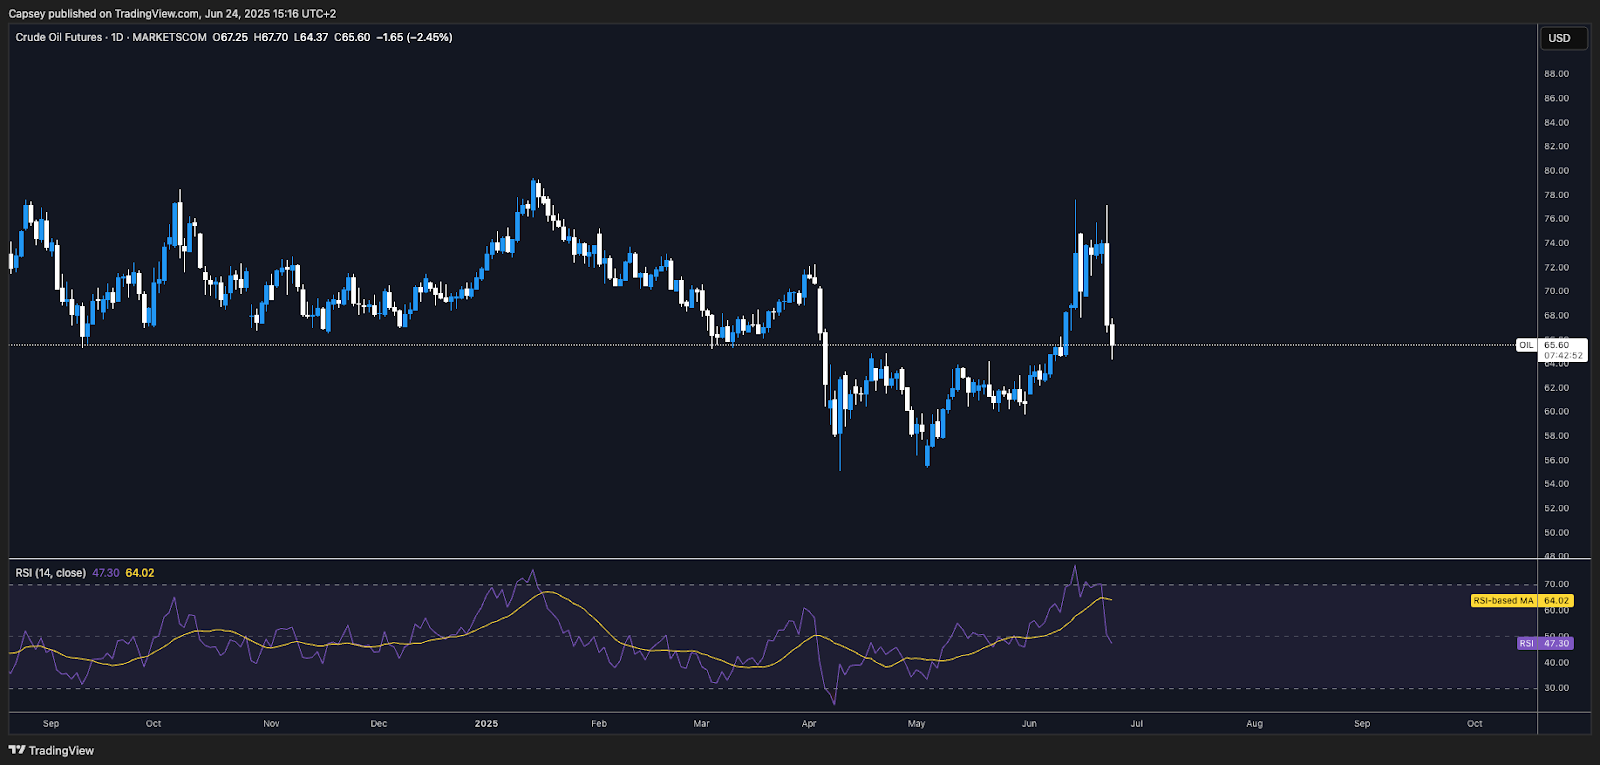
What’s next
If oil holds below recent highs and the ceasefire broadly sticks, watch for risk-on flows to return—especially with Fed policy poised to turn supportive. Will crypto break out, or does event risk keep everyone on edge?
Dovish Fed tones create setup for autumn rally
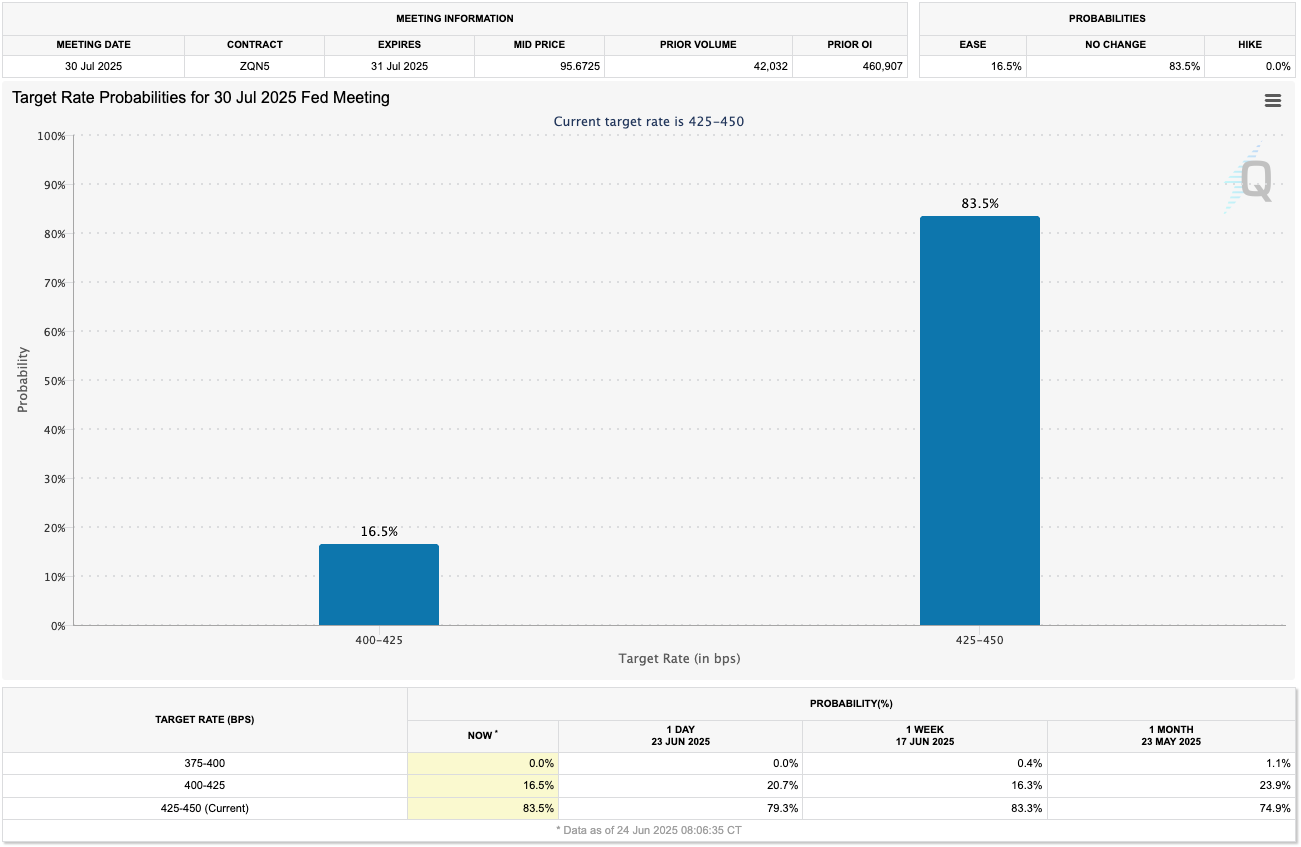
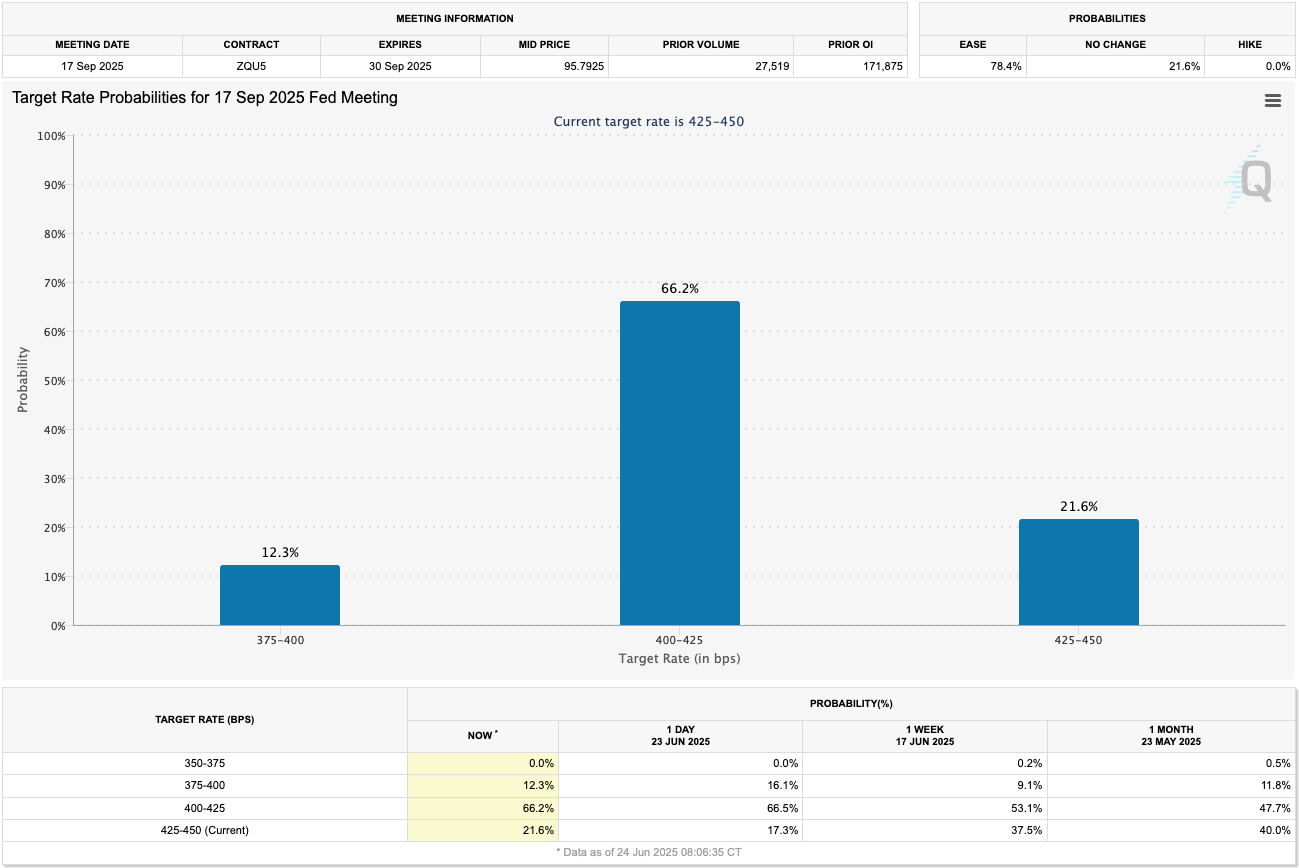
Fed members Waller and Bowman are talking up the possibility of rate cuts as early as July, if economic data justifies it. Markets, however, are betting more on September or October, pricing just a 16.5% chance for a cut at July’s meeting, but 67.6% for September. The shift comes as US inflation data softens, but fresh tariffs could still throw surprises into the mix.
Trump’s potential influence over Fed appointments tightens the focus on dovish rhetoric. Treasury yields have eased, but remain volatile amidst these political crosswinds. Friday’s PCE inflation print will be decisive—soft numbers will push cuts forward, anything sticky and expectations slip again.
30th July Fed meeting—odds of rate cut:
17th September Fed meeting—odds of rate cut:
Crypto majors rejected at key resistance: inflection looming
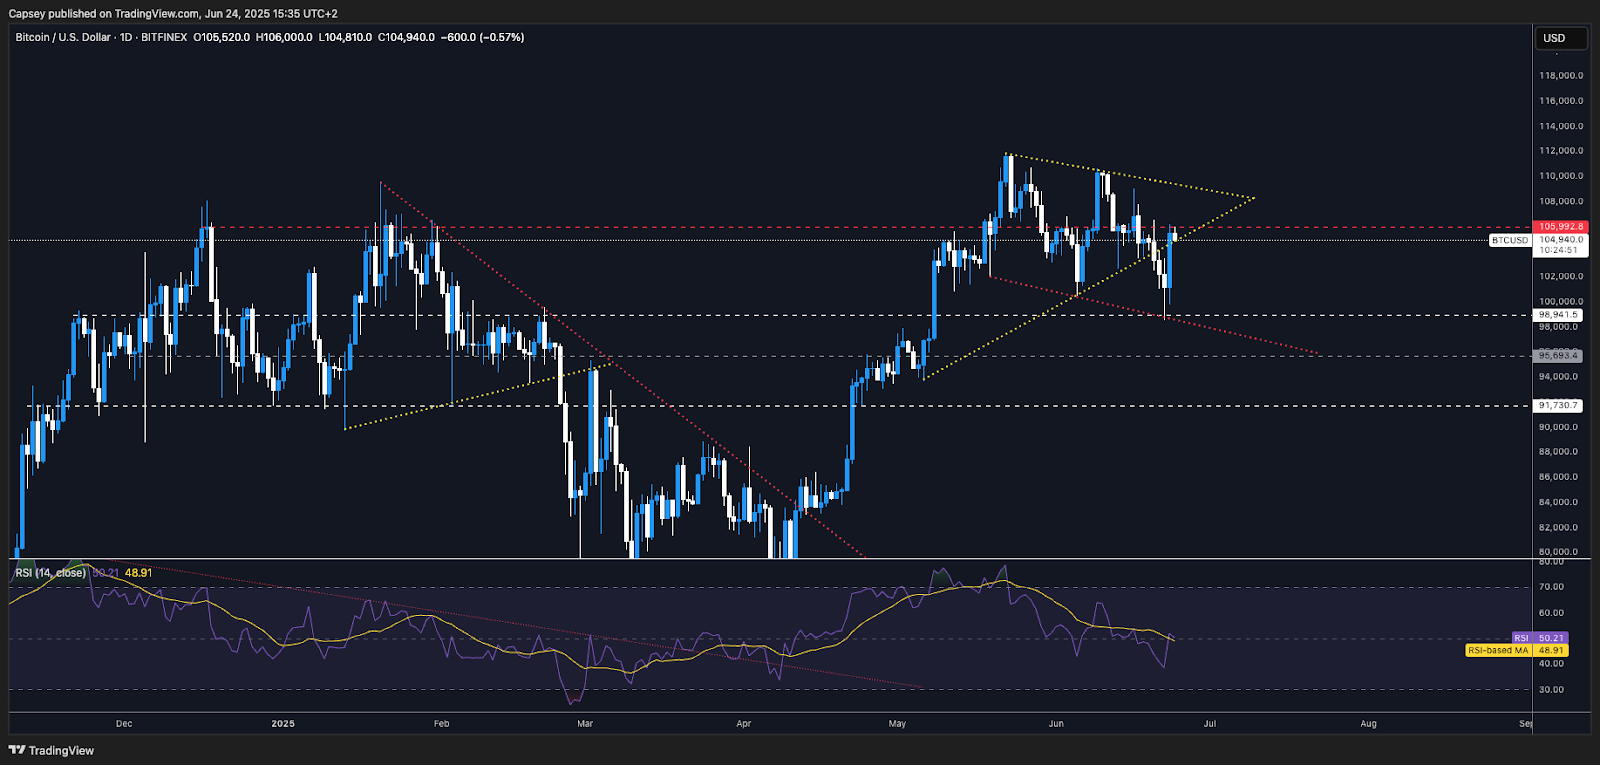
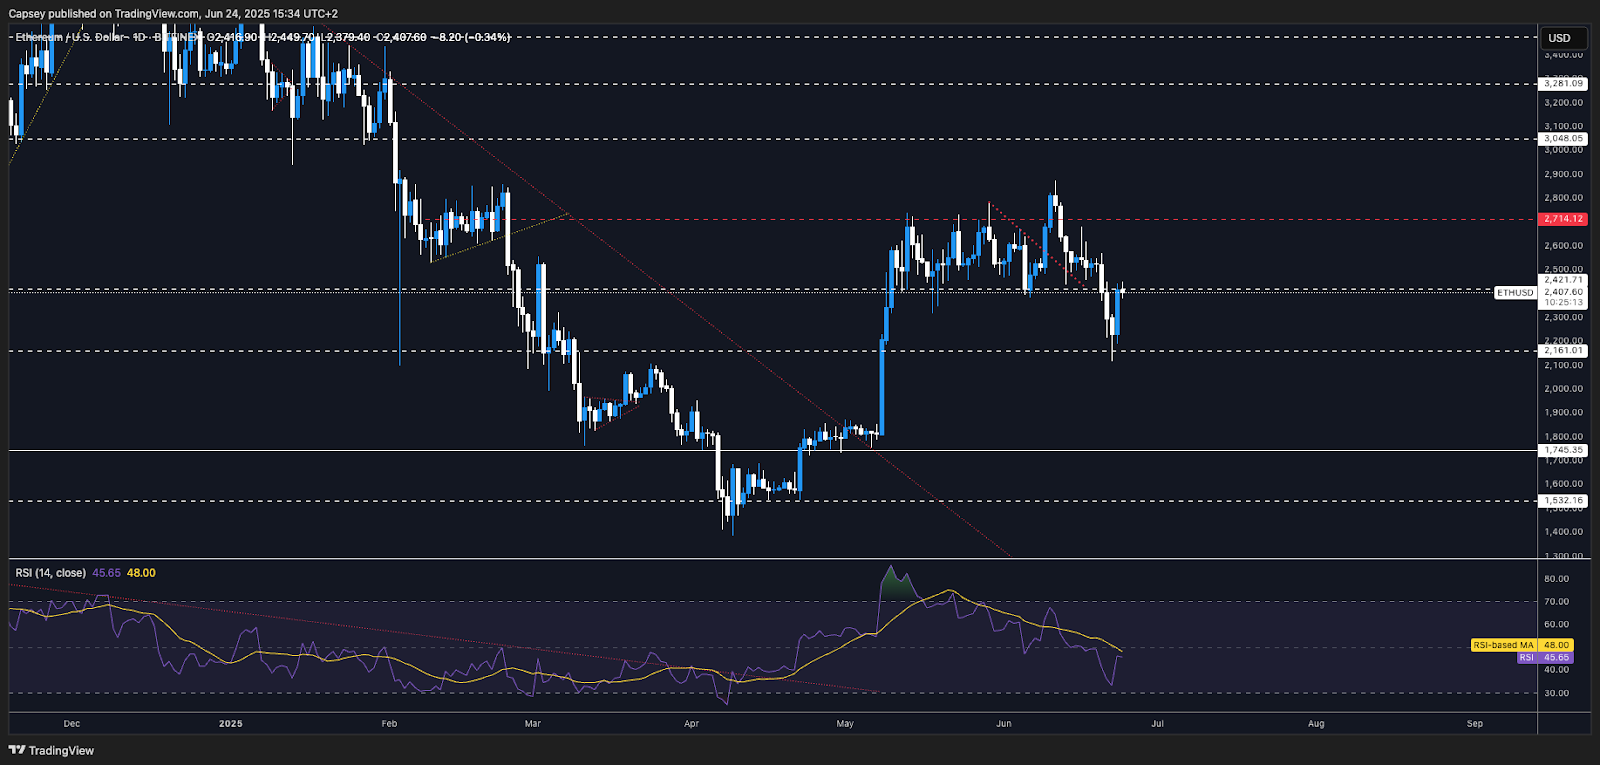
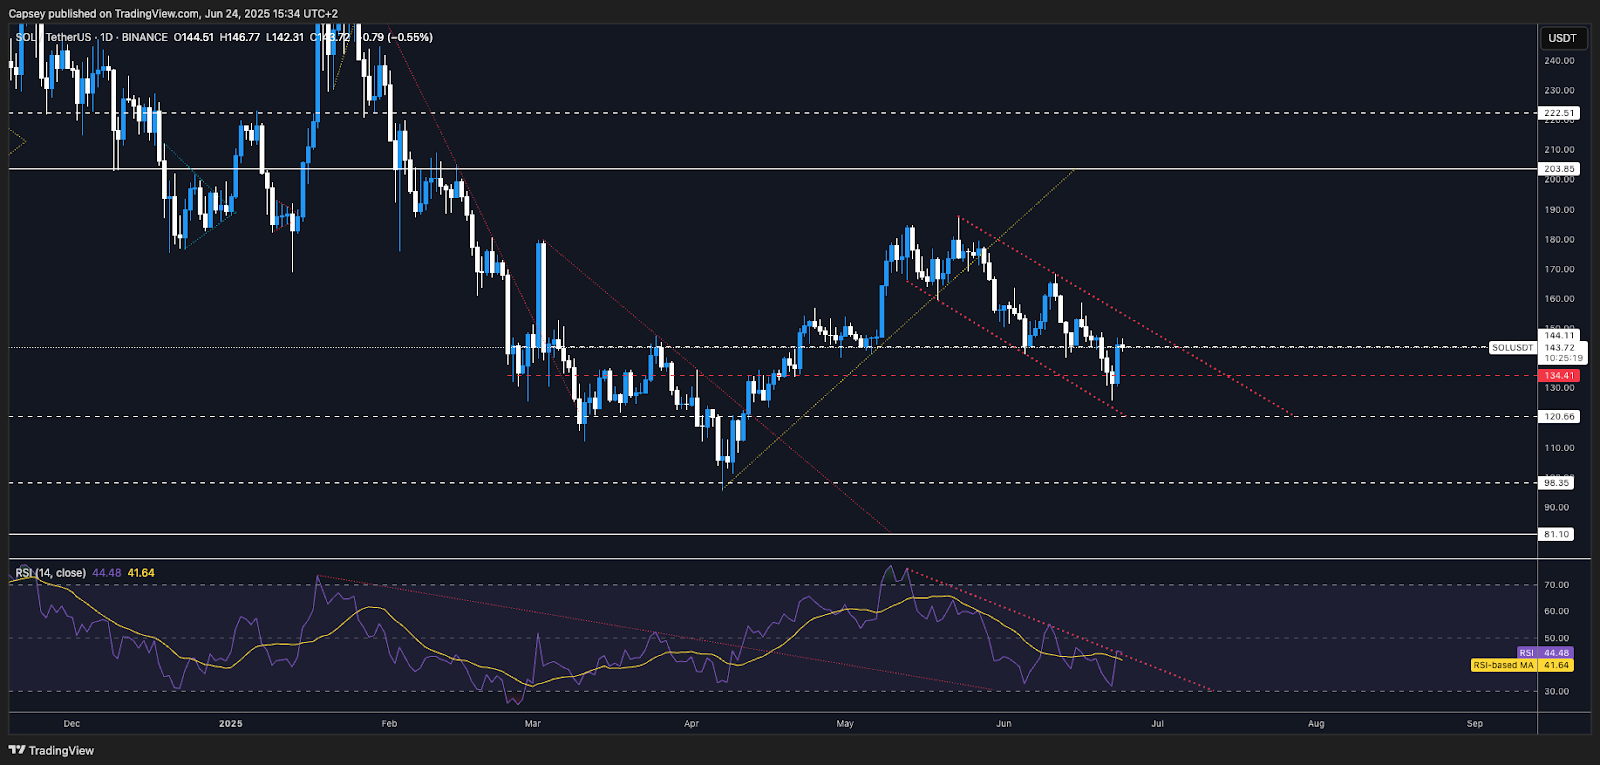
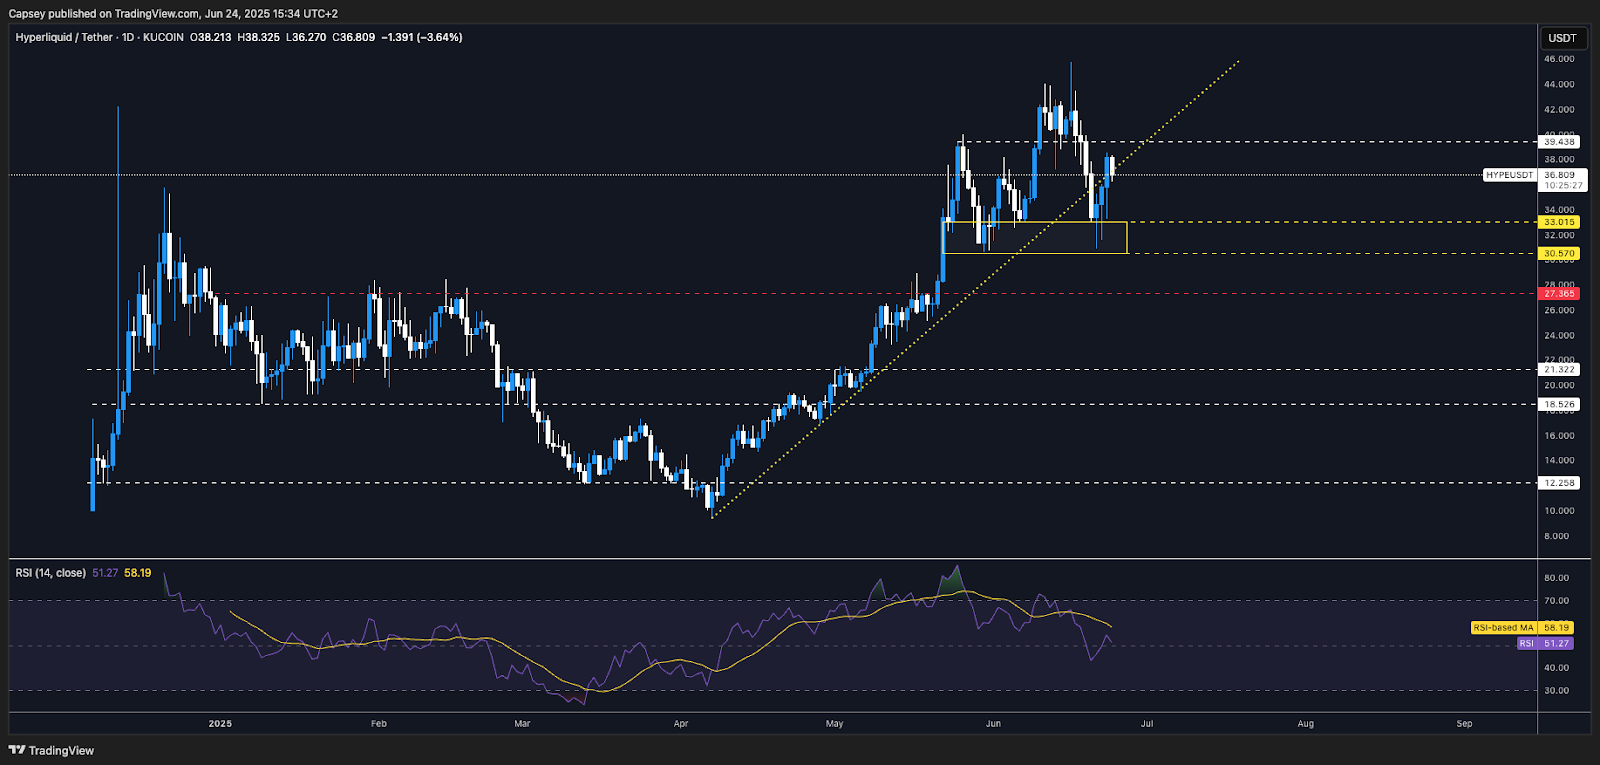
Ceasefire optimism saw BTC, ETH, SOL, and HYPE all squeeze higher—straight into structural resistance. These are the price levels to watch: BTC at $105,500, ETH at $2,420, SOL at $144, and HYPE shy of $39.40. With risk quickly repriced, expect choppy consolidation here unless buyers can push a higher low and reclaim levels with volume.
BTC 1D timeframe ($105,500 resistance):
ETH 1D timeframe ($2,420 resistance):
SOL 1D timeframe ($144 resistance):
HYPE 1D timeframe (near $39.40 resistance):
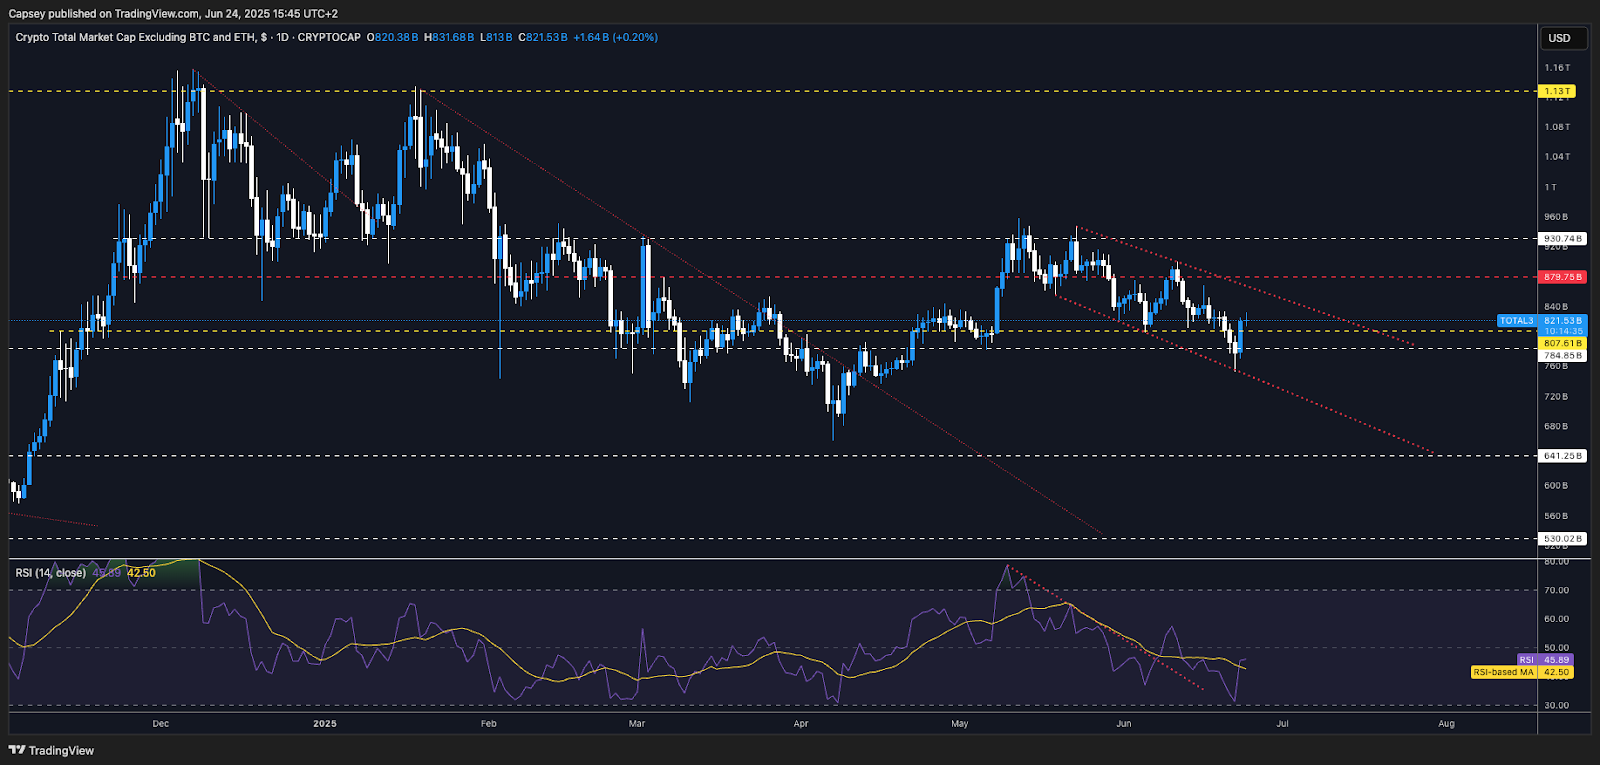
Alts and meme coins—as measured by TOTAL3—held critical supports at $784b and $807b after the Iran drama. TOTAL3 remains inside a bullish downtrend channel, and a breakout above the downtrend line over the next few weeks is now the key medium-term trigger. Expect volatile range action as traders wait for confirmation.
TOTAL3 1D timeframe:
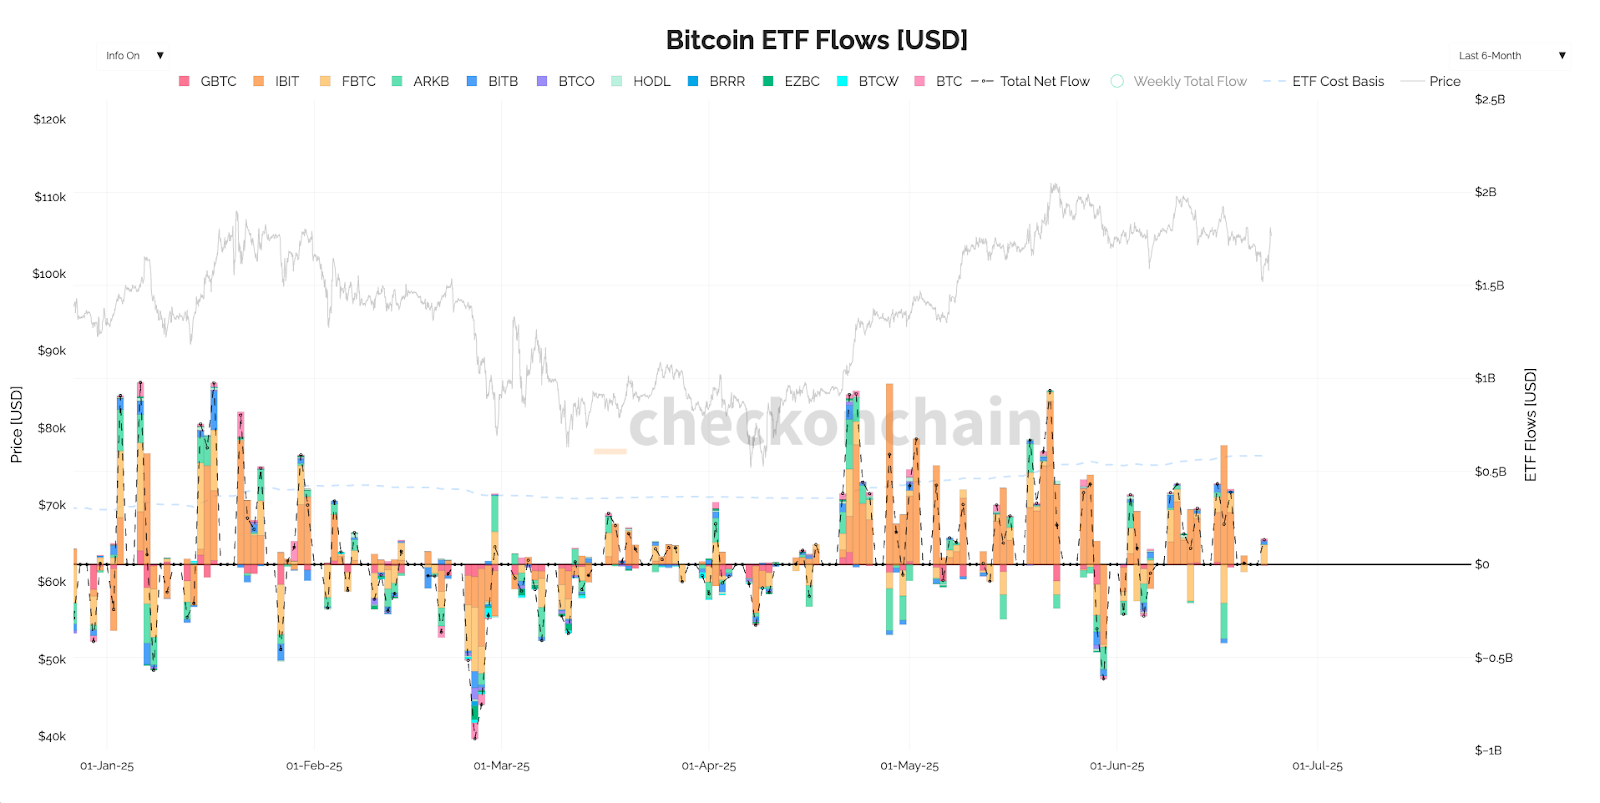
ETF inflows point to quiet strengthening beneath the noise
Bitcoin ETF inflows slowed briefly during the latest Middle East turmoil, but have otherwise remained positive. Consistent inflows—despite sideways price action—suggest institutions are quietly rotating in while retail looks distracted. The next phase could see significant capital deployment if global tensions continue to subside and Fed rate cuts are confirmed.
BTC ETF inflows:
Our take—position for Q4 rate cut, don’t chase relief rallies
The major panic is likely behind us, but so is the easy part of the rebound. The majors are boxed in below key resistance, and the market’s next real catalyst will be Fed data and global event headlines. Q4 remains the timing sweet spot for broad positioning, with any fast dips still the best buy opportunity for long-term conviction. Keep powder dry, keep emotion in check—patience has never been more powerful.
Conclusion—market faces binary risk/reward at resistance
It’s make-or-break at these levels: a failed breakout could bring sharp short-term retraces, whereas clear consolidation and reclaim above $105,500 (BTC), $2,420 (ETH), and $144 (SOL) would set up runways toward Q4’s bullish thesis. Watch ETF flows—if they accelerate and global risks abate, a sustained move higher is in play. Avoid FOMO, add selectively, and stay disciplined into the late-summer lull.