Hello world
# Critical crypto crossroads: BTC tests $110k, ETH preps breakout, SOL eyes $185, HYPE faces resistance
Market volatility spikes as Bitcoin approaches all-time highs while Ethereum builds bullish momentum. Solana holds crucial support and altcoins show mixed signals in this pivotal trading week.
TLDR:
- BTC: Bullish above $105k; needs Spot strength to break $110k–$112k. Target: $120k.
- ETH: Range-bound ($2,420–$2,720) with bullish setup; breakout could target $3,280.
- SOL: Holding $144 support; upside target $185, with potential >$200 later.
- HYPE: At resistance, likely pullback to $30-$33 range expected.
BTC:
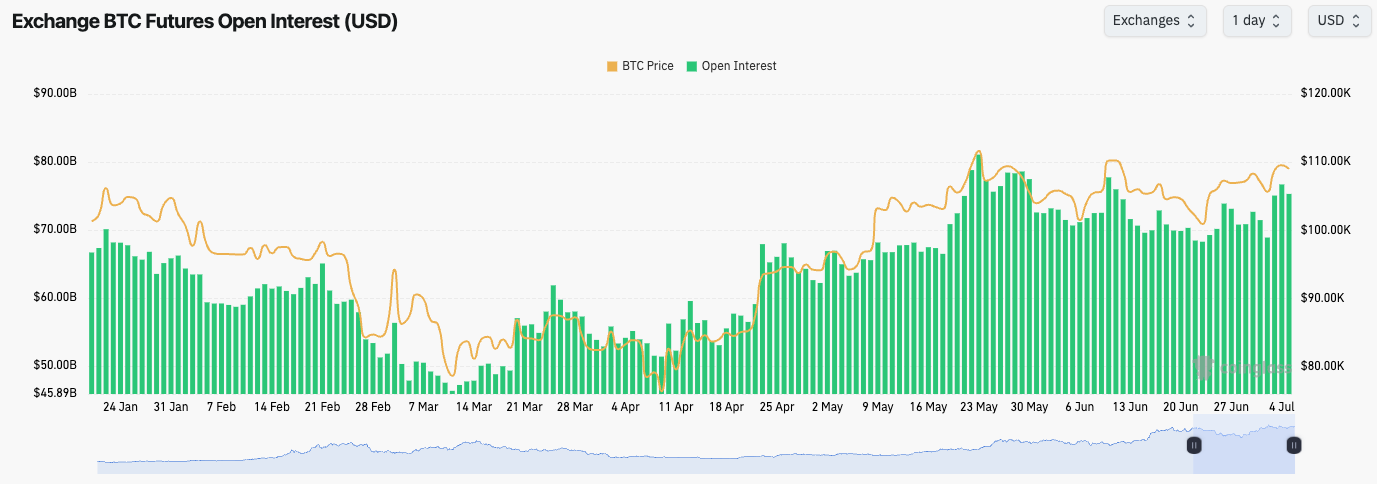
- BTC’s Open Interest is up 10% from the $105k levels, suggesting that the positive price action we’ve seen in the last few days was mostly leverage driven. There is still a positive Spot bid, although there were a lot of Asks/Sellers into $110k.
- BTC’s Funding Rate is positive, suggesting there is a slight bias amongst traders to be Long, however, the Funding Rate has fluctuated between slightly positive and negative over the last week.
- There are little signs of froth in the leverage market, and for BTC to breakout of $110k-$112k, it’ll likely need a greater Spot bid.
BTC’s Open Interest (by USD value):
Technical analysis
- BTC pulled back to the horizontal level of $106,000 and bounced, as we expected it would, and called for in Monday’s Market Direction.
- BTC has been in a broadening downtrend wedge pattern since late May. Price has just broken out above the top border of the broadening wedge pattern in the last two days.
- It’s important that price holds above the top border of the broadening wedge, however, if price is north of $105k, it remains in a bullish structure.
- The local resistances are at $110,700 and then the all-time high of $112,000.
- To the downside, the horizontal supports are at $106,000 and then a zone between $102,500 and $103,500.
- The RSI has broken out of its downtrend line and it’s above its moving average, whilst it remains in middle territory. This is a bullish structure, and it suggests that there is more upside to be had in the medium term.
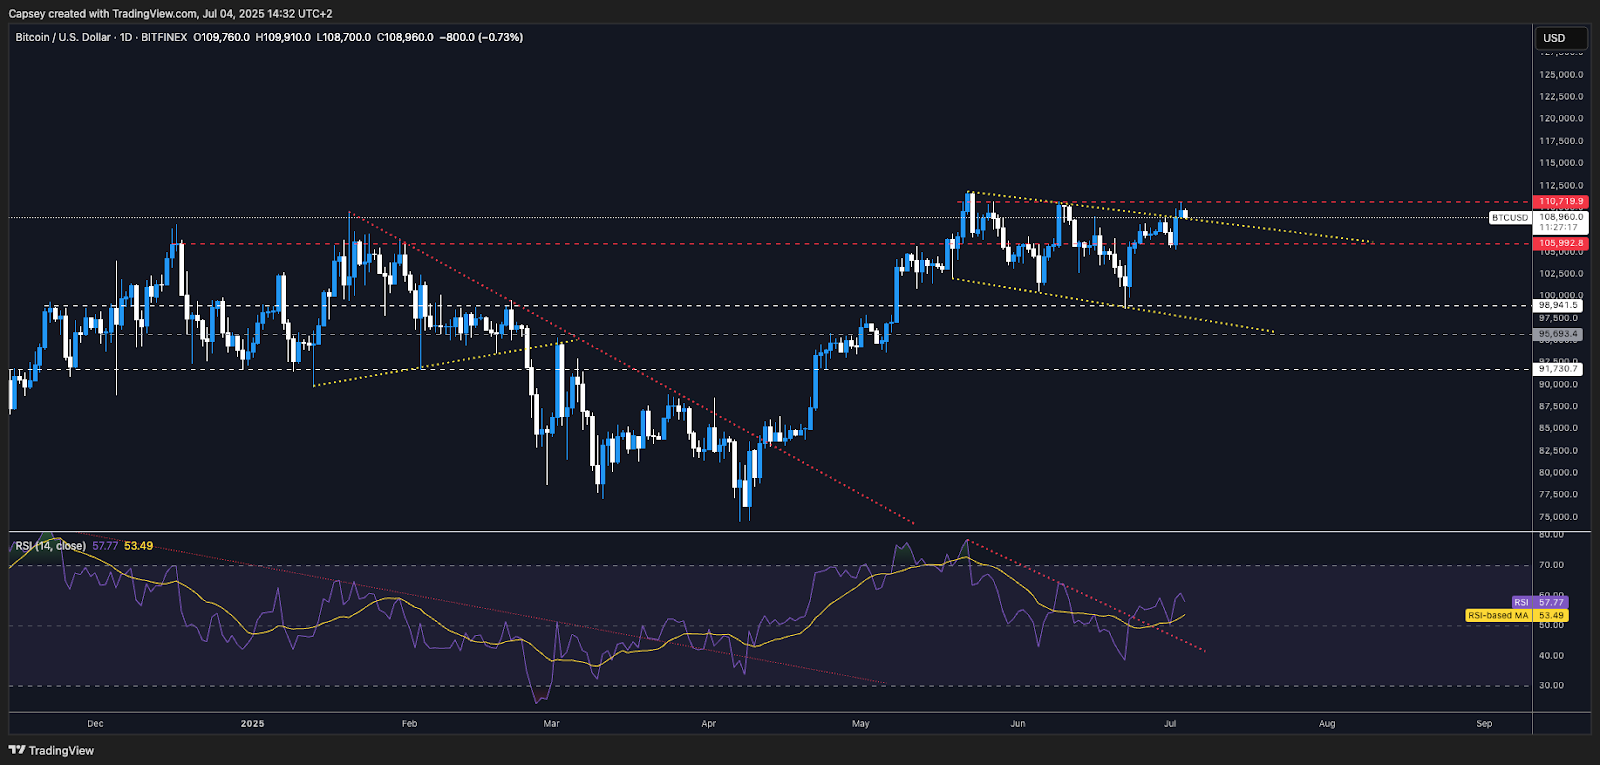
- Next Support: $106,000
- Next Resistance: $110,700
- Direction: Neutral/Bullish
- Upside Target: $120,000
- Downside Target: $102,500
Cryptonary’s take
BTC remains in a bullish structure having broken out of the top border of the broadening wedge pattern. Price has initially pulled back from the $110,700 level following a stronger than expected jobs report yesterday, which saw Interest Rate cuts pushed slightly further out. This stalled the rally in the short-term. But with ETF flows holding firm and no new macro shocks, the bullish structure remains intact.
It is possible now that we see 1-2 weeks of chop due to rate cuts being slightly pushed out. However, the bullish chart structures remain, and therefore we remain bullish in our view that BTC will move higher over the coming weeks. Should BTC breakout of $110k-$112k, the expected first target is $120k.
ETH:
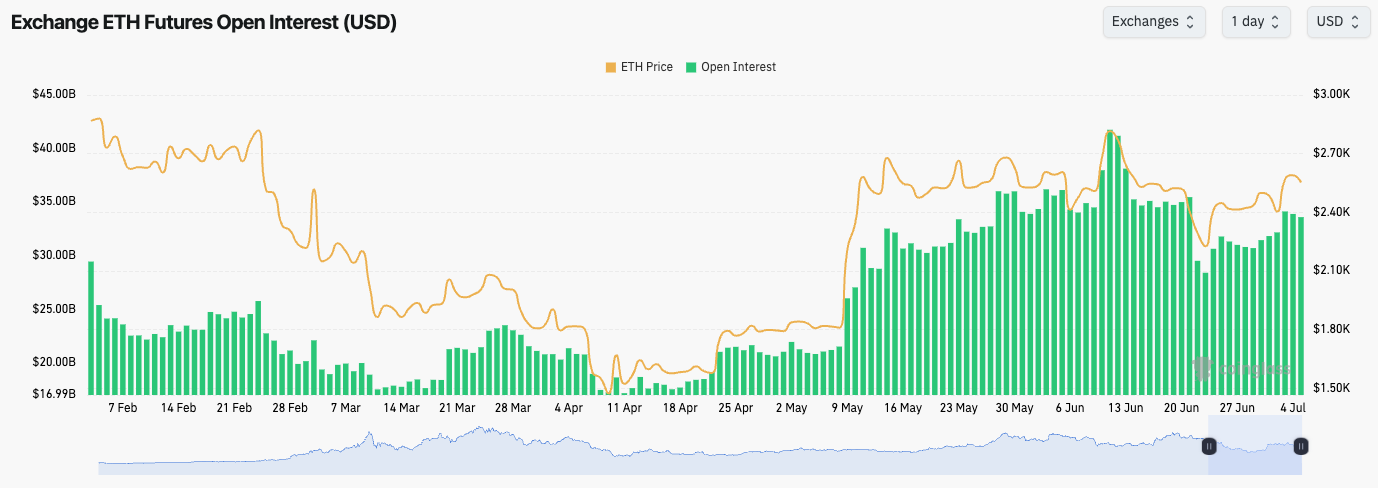
- ETH’s Open Interest has increased slightly following the lows of 23rd June; however, it remains relatively subdued.
- ETH’s Funding Rate has fluctuated between 0.00% and 0.01% suggesting that there is a slight bias to be Long, but there are little to no signs of froth in the leverage market.
ETH’s Open Interest (by USD value):
Technical analysis
- ETH bounced perfectly from the $2,160 horizontal support, with price quickly reclaiming the key horizontal level of $2,420.
- Price found support at $2,420, and has now moved higher, recovering the mid-level of the range, with price now sitting on top of a local support at $2,550.
- The main horizontal resistance is at $2,720, and then at $2,870 beyond that.
- A breakout of $2,870 would likely send ETH to $3,280.
- The RSI is in middle territory, and it’s currently attempting a breakout of its downtrend line, whilst it’s being nicely supported by its moving average. This is a bullish structure.
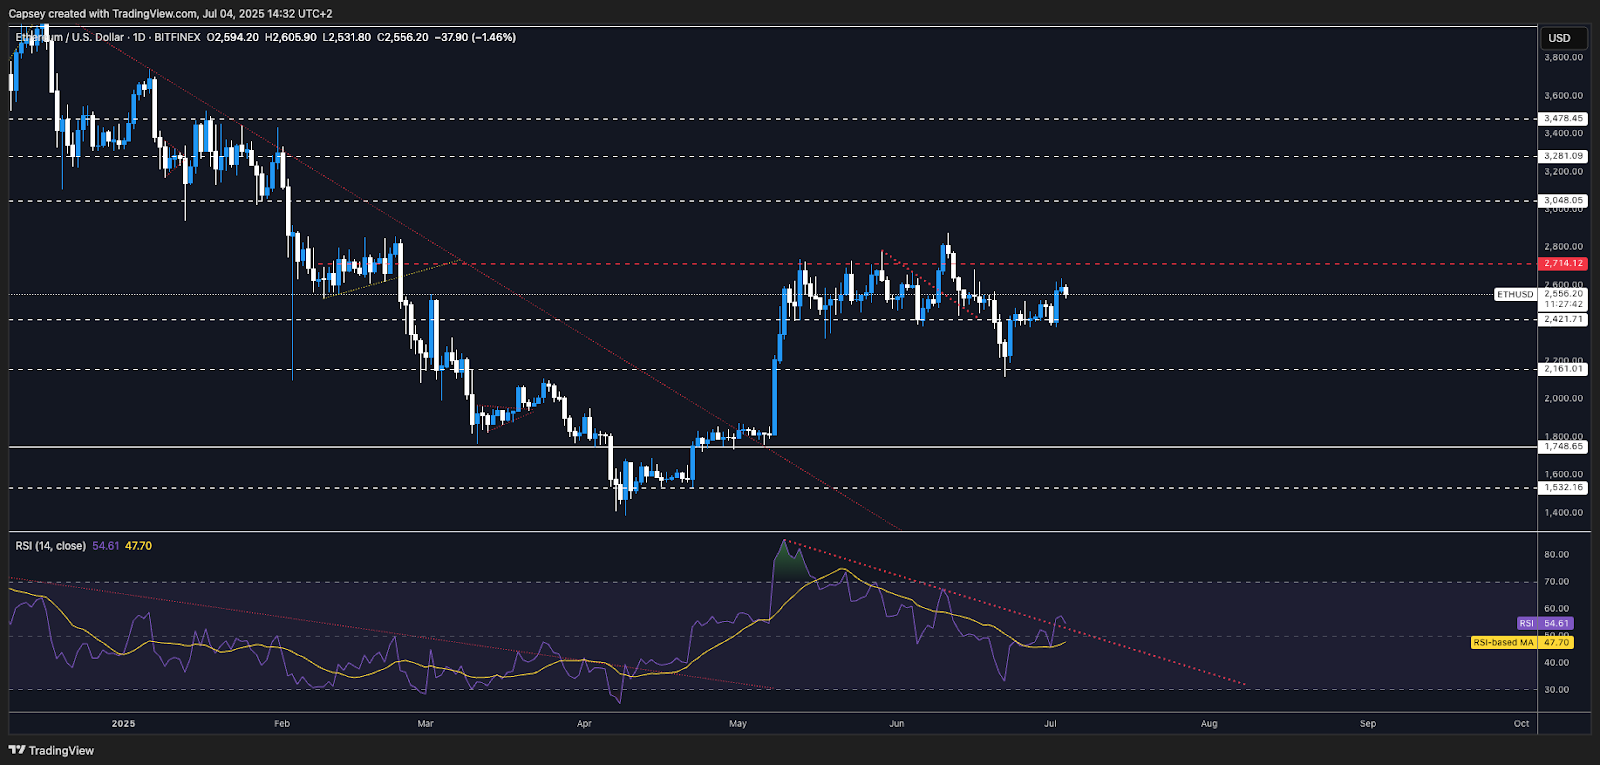
- Next Support: $2,420
- Next Resistance: $2,720
- Direction: Neutral/Bullish
- Upside Target: $3,050
- Downside Target: $2,420
Cryptonary’s take
ETH is back in its main range between $2,420 and $2,720. We’re expecting ETH to chop between this range for the next 1-2 weeks, however, our expectation is that ETH’s next major move is a breakout above $2,720. Assuming we see this, ETH is likely to retest $3,000 in the coming months.
We would use retests of the range lows ($2,420) as levels to accumulate ETH if you’re currently under-exposed, with a view to selling the position in 12 months’ time, well north of $3,200.
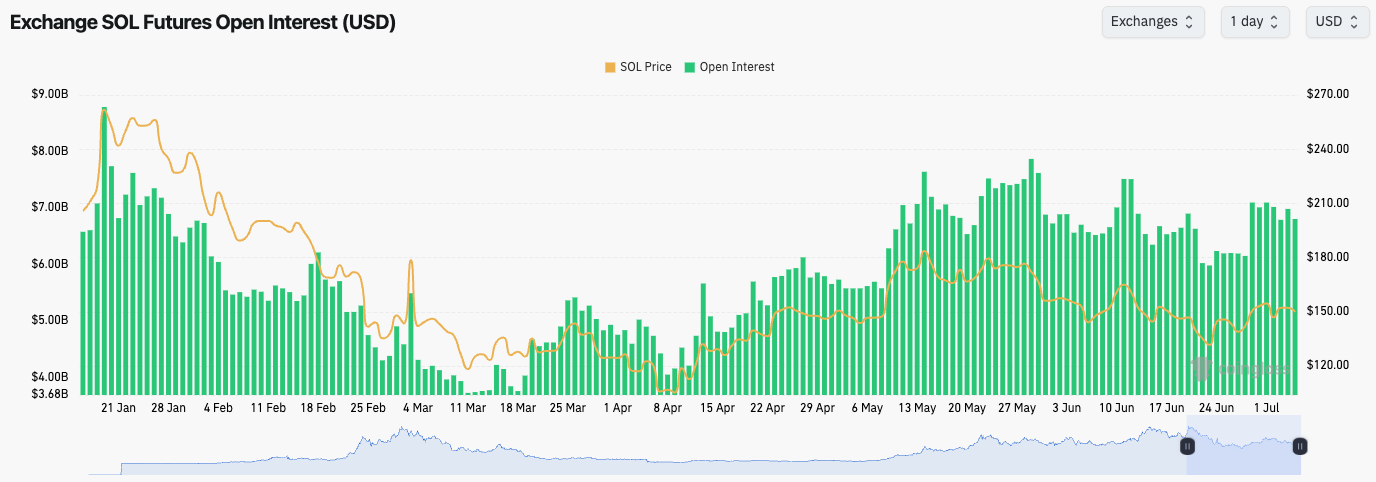
SOL:
- SOL’s Open Interest has picked up in the last week following price bouncing from $130.
- SOL’s Funding Rate has fluctuated between positive and negative, suggesting indecision amongst traders.
- For now, there are no signs of froth in the leverage market, although price needs to see a more sustained Spot bid for price to move more meaningfully higher.
SOL’s Open Interest (by USD value):
Technical analysis
- Price bounced from $130, and it swiftly recovered the key horizontal level of $144.
- In the last week, price has broken out of the downtrend channel,