BTC, ETH, SOL, HYPE, AURA — Consolidation Near Highs, Breakouts in Play
The majors are consolidating near all-time highs, with key supports and breakout zones setting up critical trading opportunities this week.
Bitcoin and Ethereum show strength near recent highs; SOL, HYPE, and AURA approach key resistance zones with potential for major breakouts ahead.
TLDR:
- BTC consolidating near highs; $112k–$115k seen as buy zone.
- ETH overbought; pullbacks to $3,280–$3,480 favoured for buys.
- SOL resistance at $185; support at $154–$165.
- HYPE support at $44; dips to $39.40 attractive.
- AURA bullish breakout; targeting $0.35–$0.40.
BTC:
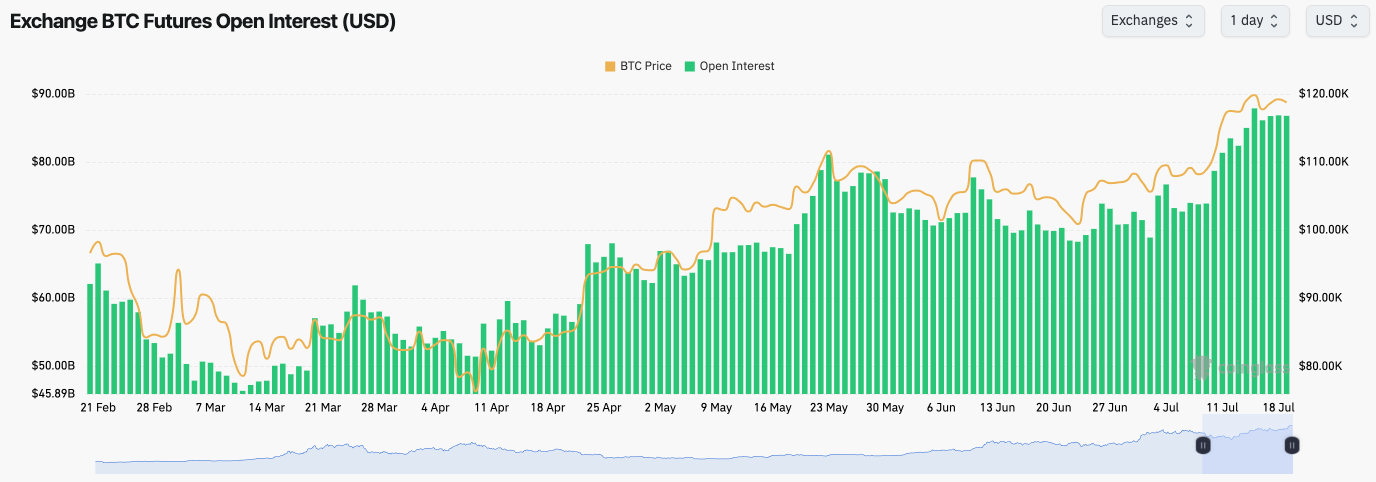
- BTC’s Open Interest has pulled back very slightly but it remains elevated.
- BTC’s Funding Rate is positive, just north of 0.01% suggesting that the bias amongst traders is to be Long.
- Overall, BTC’s leverage market isn’t too frothy yet, but it’s beginning to make its way in that direction. Leverage flush outs (price down) are becoming more likely. However, these flush outs should be seen as buying opportunities.
BTC’s Open Interest (by USD value):
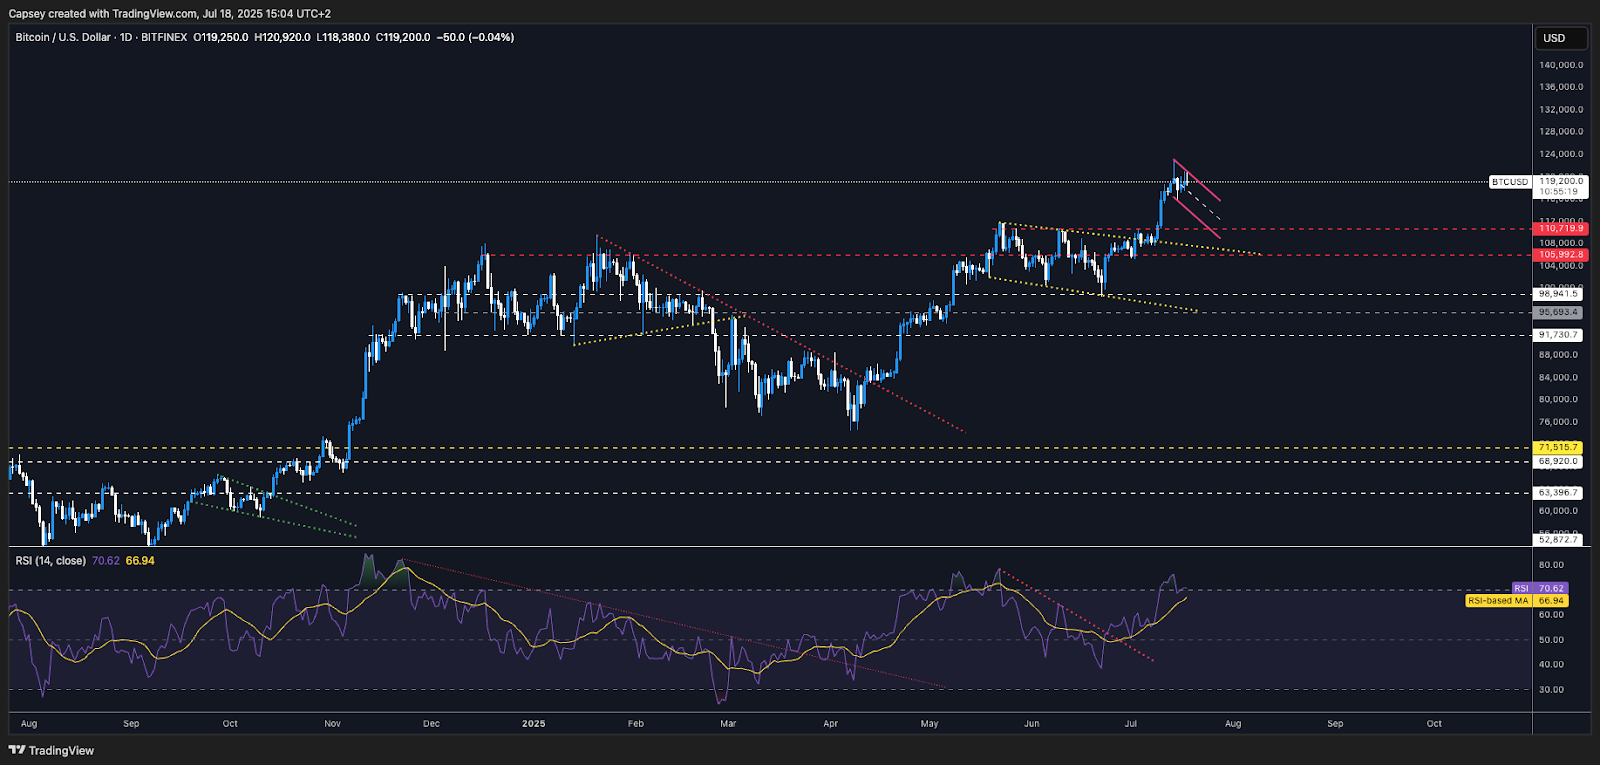
Technical analysis
- BTC broke out of the main resistance zone of $110k-$112k, with price extending to new all-time highs of $123k.
- Price is now consolidating around all-time highs. The range for the consolidation that we’re looking at is $115k-$123k.
- Should price break down and enter the $112k-$115k zone, we’d expect this to be strong support and therefore a buying opportunity for BTC.
- The resistance for price to the upside is the all-time high at $123,000.
- To the downside, $112k-$115k would be a strong zone of support.
- It’s possible that BTC is forming a bull flag pattern, however it’s early stages of the formation, so we’ll need to be flexible as to how the price formation develops.
- The RSI has pulled back from overbought territory, although this indicator hasn’t exactly reset yet. The positive is that there aren’t any bearish divergences forming yet.
Cryptonary’s take
In the immediate term, it’s tricky to know what Bitcoin is doing here. BTC may either be consolidating below all-time highs for a breakout or entering a distributive phase. Our base case is continued consolidation with any dips to $112k-$115k being strong buys. Our expectation beyond that is for a move back to all-time highs and into the $130k’s in the medium term, and therefore if we’re given a dip to $112k-$115k, we’d be buyers of it.
Our view remains that BTC is at or north of $150k by year end, and therefore we’ll continue to use pull backs as meaningful buying opportunities.
- Next Support: $112k-$115k
- Next Resistance: $123k
- Direction: Neutral/Bullish
- Upside Target: $135k
- Downside Target: $112k
What’s next?
Bitcoin and Ethereum consolidation patterns will determine short-term direction. SOL eyes a $185 breakout, while HYPE and AURA look primed for strong moves if supports hold or break.
ETH:
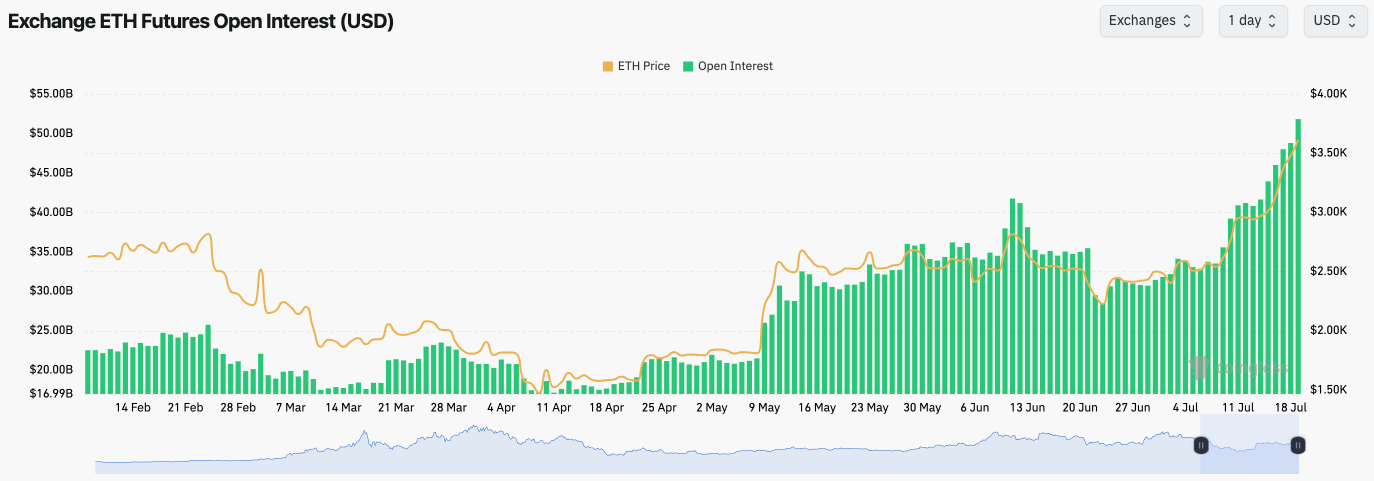
- ETH’s Open Interest has risen to all-time high levels, although we’re seeing small pull backs in Open Interest on local timeframes, as late Longs chase price higher, and then get flushed out.
- ETH’s Funding Rate is meaningfully positive, now comfortably above 0.01%. This indicates that the bias amongst traders is to be Long, and they’re willing to pay an elevated premium to be Long. This is usually a sign that a leverage flush out is close.
ETH’s Open Interest (by USD value):
Technical analysis
- This is a huge move higher from ETH. Once we saw a breakout of the horizontal resistance of $2,720, $3,050 was quickly retested.
- Price briefly consolidated under the $3,050 horizontal resistance before breaking through. Price then swiftly broke out of the next resistances at $3,280 and $3,480.
- The next major horizontal resistance to the upside is $3,970.
- To the downside, we expect the prior levels of $3,480 and $3,280 to become new supports should price pull back.
- ETH has essentially been straight up over the last 10 days, up 45% from the July 8th low.
- The RSI is extremely overextended to the upside here (overbought). This is the most overbought ETH has been since early May, but before that, March 2024.
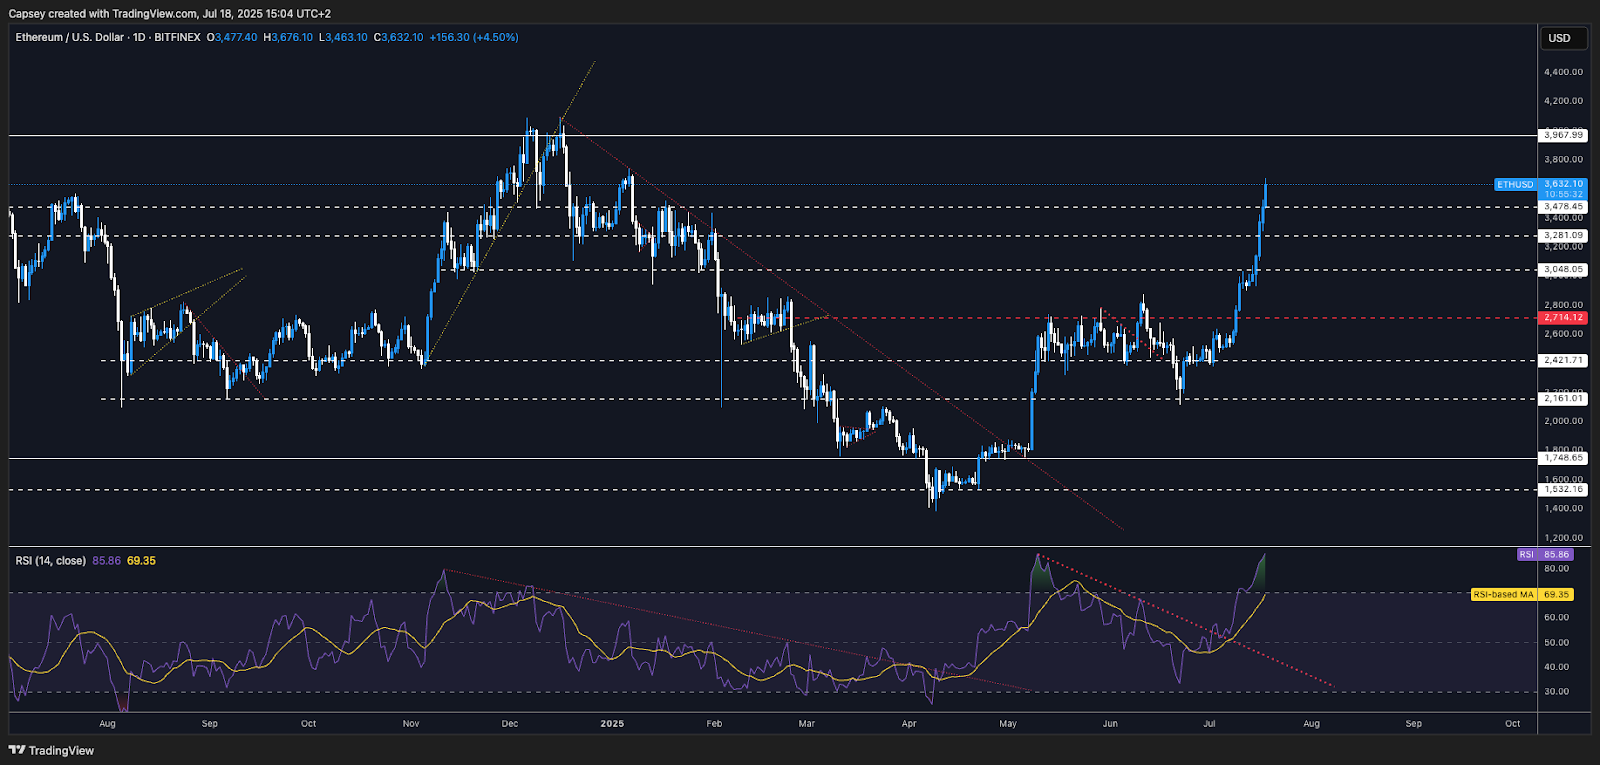
Cryptonary’s take
Considering how overbought ETH is here, we’d expect price to consolidate for a short period or put in a small pull back. These pull back levels might be down to $3,480, and if deeper, then $3,280. It’s possible that price does keep running higher, but with the move higher that ETH has put in over the last 1-2 weeks, it’s likely there will be a period of profit-taking, with current prices likely to be it.
We’d therefore expect a small pull back with retests of $3,480 to $3,280 as the support zone. For those that are underexposed to ETH, we’d suggest adding to long-term Spot ETH bags towards the bottom of this range at $3,280 as this is a strong long-term buy zone.
- Next Support: $3,280-$3,480
- Next Resistance: $3,970
- Direction: Neutral
- Upside Target: $3,970
- Downside Target: $3,280
SOL:
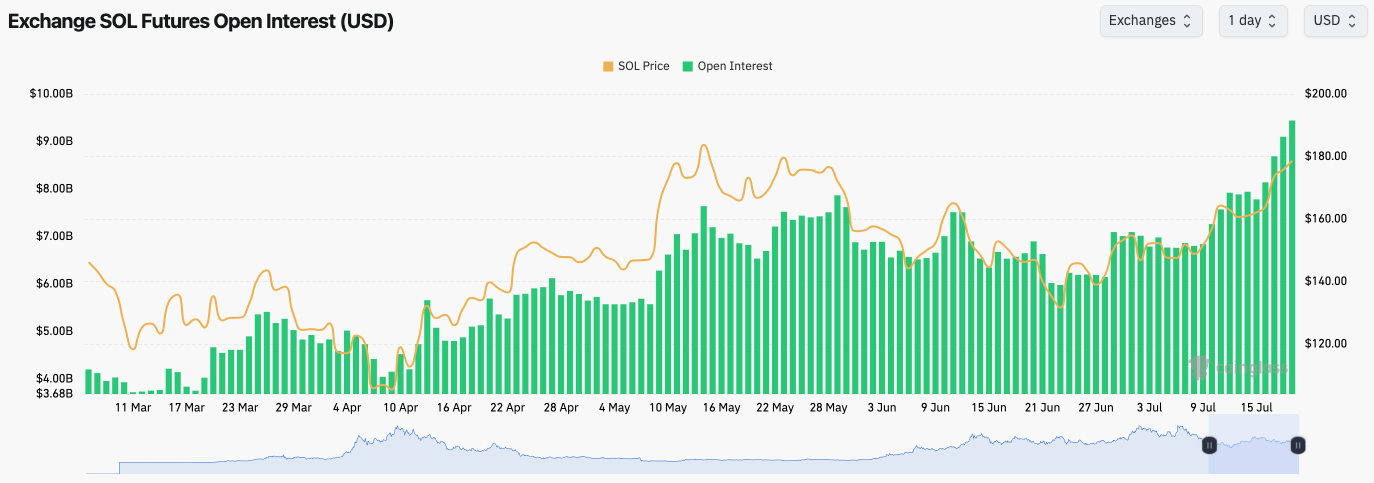
- SOL’s Open Interest is up substantially and at new all-time highs.
- SOL’s Funding Rate is now at 0.024% which suggests that traders are paying a significant premium to be Long.
- SOL is vulnerable to a leverage flush out here, although that price dip should be bought.
SOL’s Open Interest (by USD value):
Technical analysis
- SOL broke out of its downtrend channel, and its local downtrend line, which allowed price to kick up to the local resistance at $165.
- Price briefly consolidated at $165, before we saw another leg higher, and price retested the major horizontal resistance at $185. Price has seemingly rejected for now.
- It is possible we see the same play for SOL, as we saw for BTC and ETH – a consolidation below the highs (in this case $185), and then a breakout that then retests much higher levels.
- To the upside, the key levels for SOL are at $203 and $222.
- Should price pull back, we’re looking at the $154 to $165 zone to a be a strong region of support for price.
- The RSI has just entered overbought territory, although we’re not seeing severely high levels like we’re seeing for ETH. There is some room for SOL to continue moving higher here, although we see immediate term upside as limited.
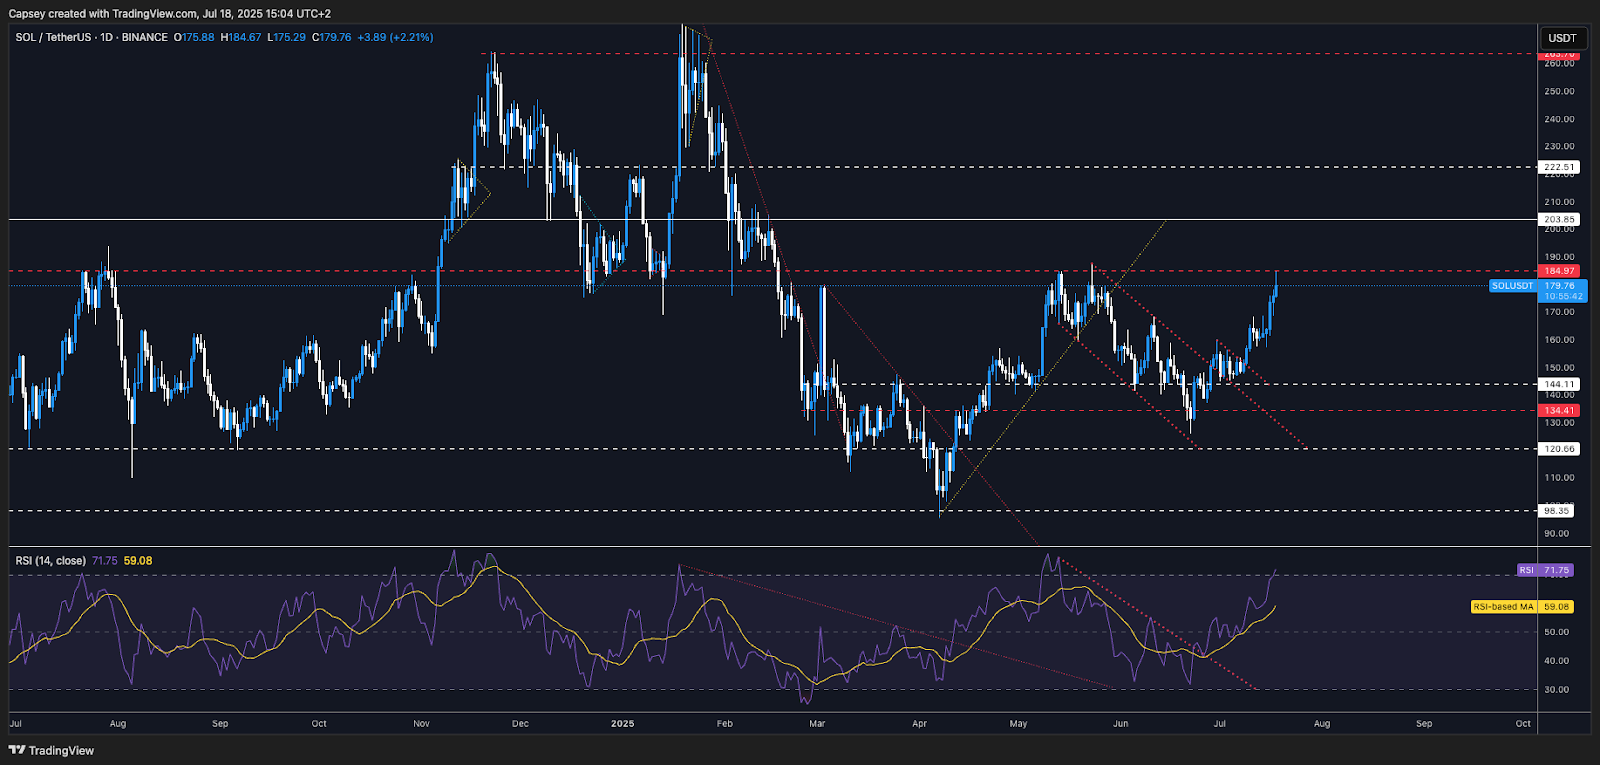
Cryptonary’s take
SOL has potentially reached a local resistance here in the short-term at $185. It is possible however that price consolidates under $185 in the immediate term, before we see a breakout of $185 and that can then set price up to retest $203 to $222 range.
Should price revisit the $154 to $165 range, we’d look to bid SOL there with a view to holding the position for the next 12 months.
- Next Support: $154-$165
- Next Resistance: $185
- Direction: Neutral/Bullish
- Upside Target: $203
- Downside Target: $154
HYPE:
- Price recently locally topped at $49.90, just shy of the key horizontal resistance of $50.00, a big psychological level.
- Price is now finding support on top of the long-term and recovered uptrend line, along with the prior all-time high at $45.00.
- To the upside, the $50.00 level remains the key resistance.
- To the downside, we expect $39.40 to $44.00 to be a strong zone of support. For those that are underexposed/0 exposure, we’d suggest beginning to build positions in HYPE in that support zone.
- The RSI has more meaningfully reset; however, it has put in back-to-back bearish divergences (higher highs in price, and lower highs on the oscillator), meaning a deeper pull back remains possible.
HYPE’s Open Interest (by USD value):
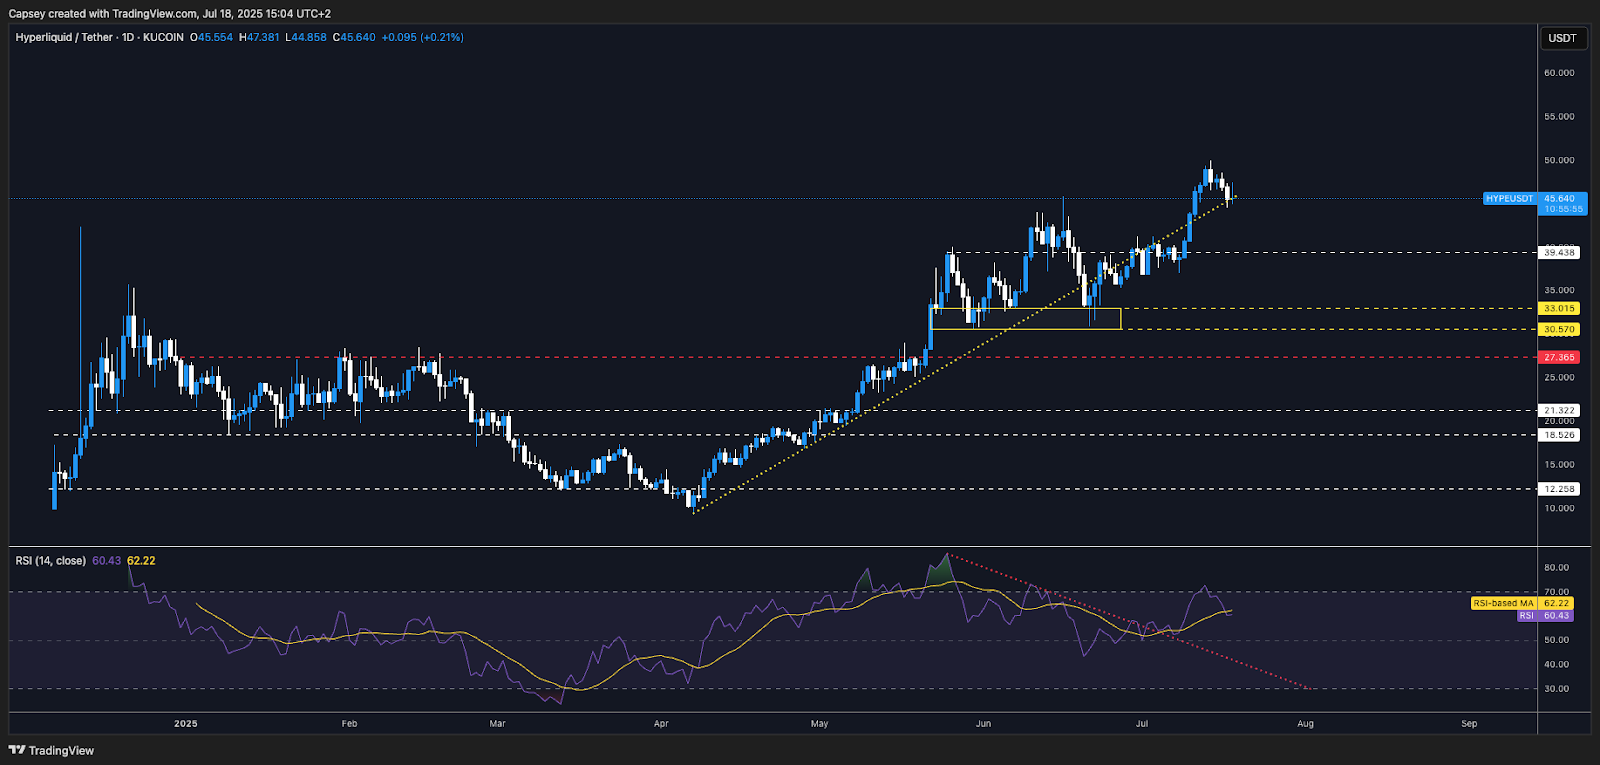
Technical analysis
- Should HYPE pull back to $39.40 to $44.00, we’d suggest adding buys at those price levels, particularly for those that are underexposed. If price were to fall below $39.40, we’d be more aggressive buyers of HYPE.
Cryptonary’s take
HYPE has been one of the strongest performers, and it has given sideliners little chance to get in, as there have been very few opportunities for them to buy the dip.
- Next Support: $44.00
- Next Resistance: $50.00
- Direction: Neutral
- Upside Target: $50.00
- Downside Target: $39.40
AURA:
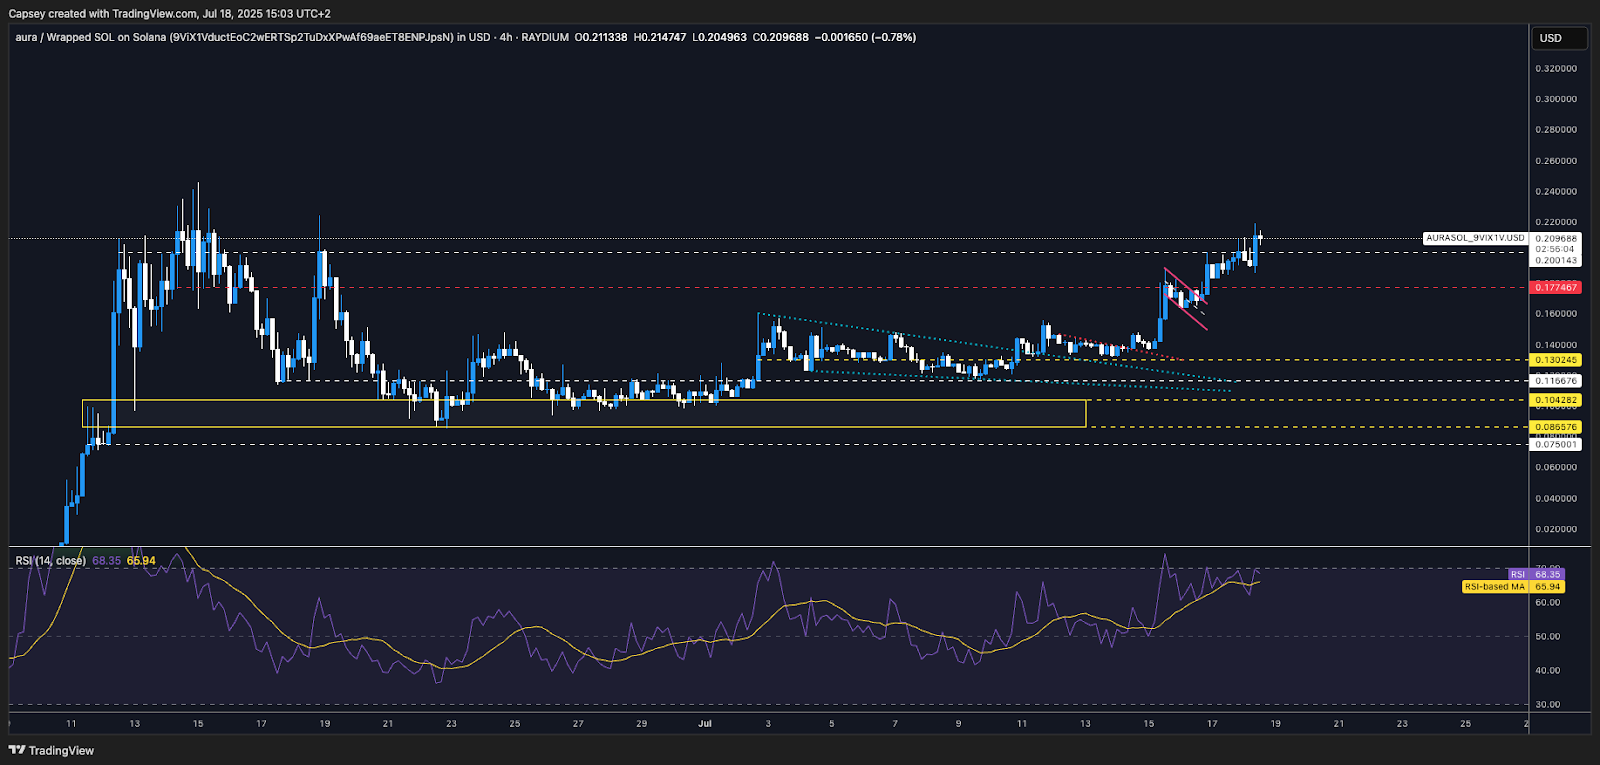
- Note; for AURA we’ll remain analysing it on the 4hr timeframe rather than the Daily timeframe.
- Price broke out of the descending wedge (turquoise lines) and price was then able to hold the $0.13 horizontal support. This gave price the support it needed to then propel higher.
- Price then broke upwards and retested the key horizontal resistance of $0.177. Price consolidated below $0.177, forming a bull flag, which then broke out.
- Price has since found some slight resistance at $0.20, which is to be expected considering it’s a psychological level.
- To the upside, the key horizontal resistances are now at $0.20 and $0.24.
- To the downside, $0.177 should be a strong horizontal support for price.
- Price is continuing to follow the path of its ‘cup-and-handle’ pattern. This pattern would now suggest a small period of consolidation between $0.177 and $0.240, before a breakout to $0.35-$0.40.
AURA’s Open Interest (by USD value):
Technical analysis
- We highlighted that AURA was forming a ‘cup-and-handle’ pattern which is an extremely bullishly biased pattern, and it has a short-term price break out target of $0.35 to $0.40.
- We have remained bullish throughout the ‘cup-and-handle’ pattern formation, and we expected this structure to play out and it’s now unfolding in real time. Our short-term price targets for AURA are $0.35-$0.40. However, beyond that, our base case is that AURA will reach multi-billions in MCap.
Cryptonary’s take
We highlighted that AURA was forming a ‘cup-and-handle’ pattern which is an extremely bullishly biased pattern, and it has a short-term price break out target of $0.35 to $0.40.
We have remained bullish throughout the ‘cup-and-handle’ pattern formation, and we expected this structure to play out and it’s now unfolding in real time. Our short-term price targets for AURA are $0.35-$0.40. However, beyond that, our base case is that AURA will reach multi-billions in MCap.
- Next Support: $0.177
- Next Resistance: $0.240
- Direction: Bullish
- Upside Target: $0.40
- Downside Target: $0.177