BTC, ETH, SOL Hit Major Resistance as Ceasefire Drops Oil
Markets are exhaling after weeks of conflict, but the relief could be short-lived. Crypto majors have bounced hard—yet overheated rallies are running headlong into stubborn resistance.
A fragile Middle East ceasefire and a dovish turn from the Fed have sparked quick gains across risk assets. Oil dumped, BTC surged to $105,500, and majors like ETH and SOL rallied—only to stall at critical technical barriers. With fresh PCE inflation data and ETF flows in play, are traders looking past new risks too soon?
• Middle East tensions ease, with ceasefire holding and oil prices falling, but spike risk remains
• Fed signals rate cuts, with September or October most likely; market focusing on Friday’s PCE data
• BTC hits $105,500 resistance, while ETH, SOL, and HYPE all reach major barriers—consolidation or breakout will hinge on macro shifts
• ETF inflows stabilise, supporting Bitcoin during conflict volatility, but momentum could waver if tension resurfaces
• Israel-Iran ceasefire: Market and oil reaction
• Fed’s dovish pivot: Timing of rate cuts
• Crypto majors at resistance: BTC $105,500, ETH $2,420, SOL $144
• ETF flows: Watching for decisive sentiment shifts
• Cryptonary’s take: Accumulation strategy and risk signals
Disclaimer: This is not financial or investment advice. You are responsible for any capital-related decisions you make, and only you are accountable for the results.
Middle East ceasefire triggers oil plunge and risk rally
Markets have finally seen a tempered response after weeks of geopolitical volatility. The Iran-US standoff peaked as both sides opted for visible but calculated strikes—first a US bombing of Iranian nuclear sites, then Iran’s missile response on a US airbase in Qatar. Notably, Iran telegraphed its intentions, avoiding loss of life and inviting a diplomatic reset. Yet, further missile launches into Israel have kept nerves on edge.
Still, the core takeaway: Oil dropped sharply on the ceasefire, signalling broader market belief in de-escalation and removing a key inflation risk. Absent a sustained oil surge, fears of global supply shocks or US escalation have faded—at least in the short term.
Oil 1D timeframe:
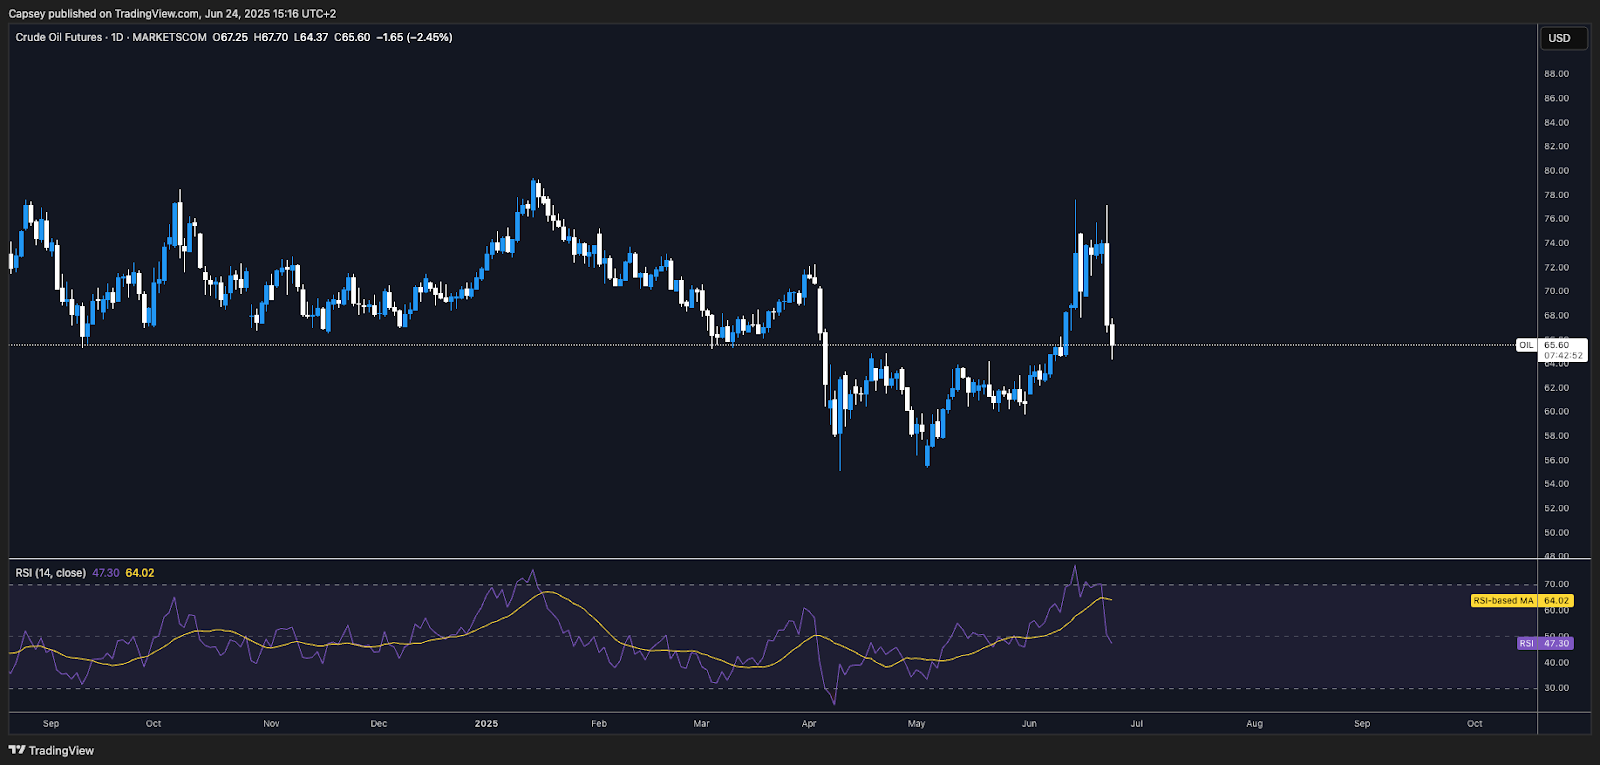
Had Iran threatened the Strait of Hormuz or propelled oil past crisis levels, inflation risk would have surged and market dynamics flipped. Instead, oil’s collapse confirms the market’s focus is shifting from geopolitics to macro and Fed policy.
What’s next
A ceasefire has brought temporary peace, but risk remains—any breach could reignite volatility in oil and global markets. Will the Fed’s upcoming data finally break the deadlock, or will geopolitical aftershocks send another tremor through risk assets?
Fed signals cuts: September or October trigger?
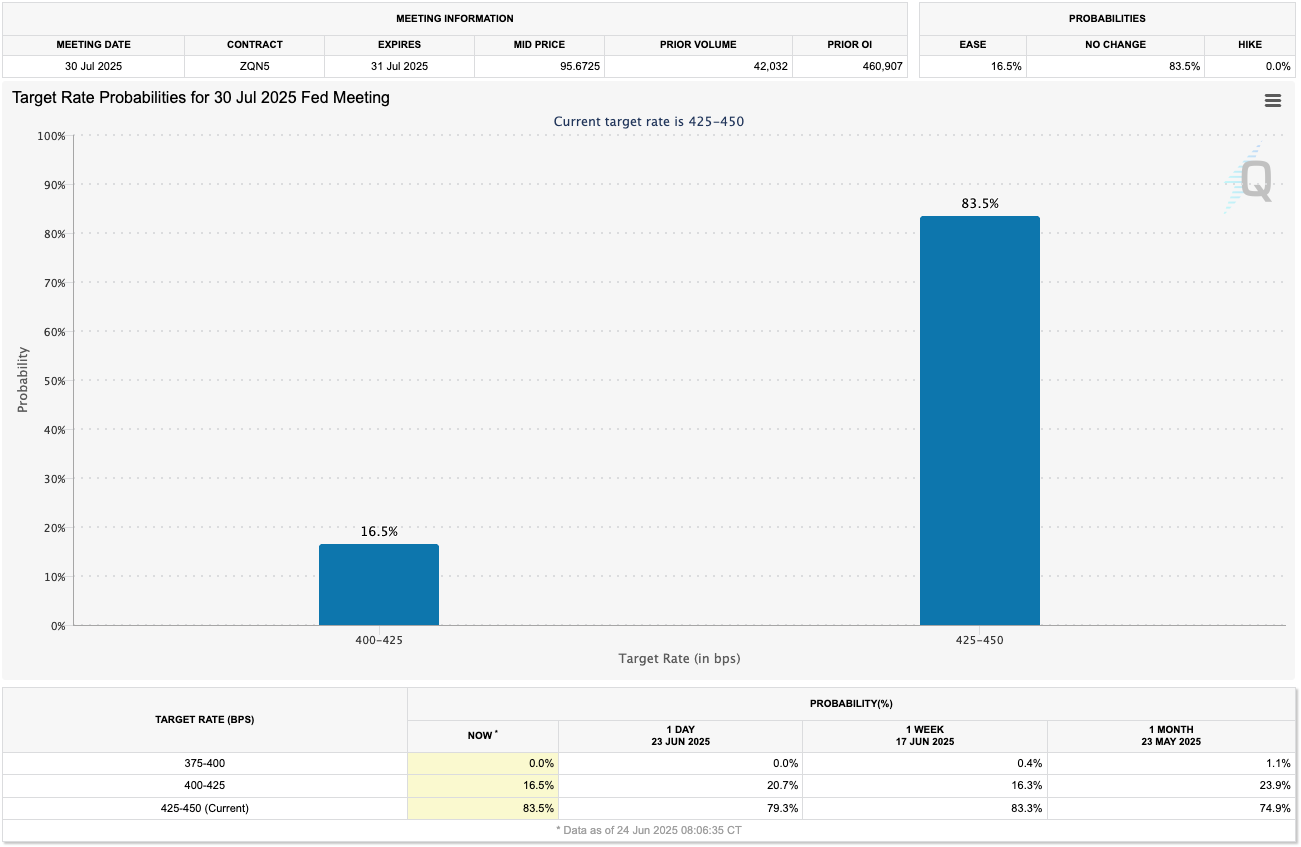
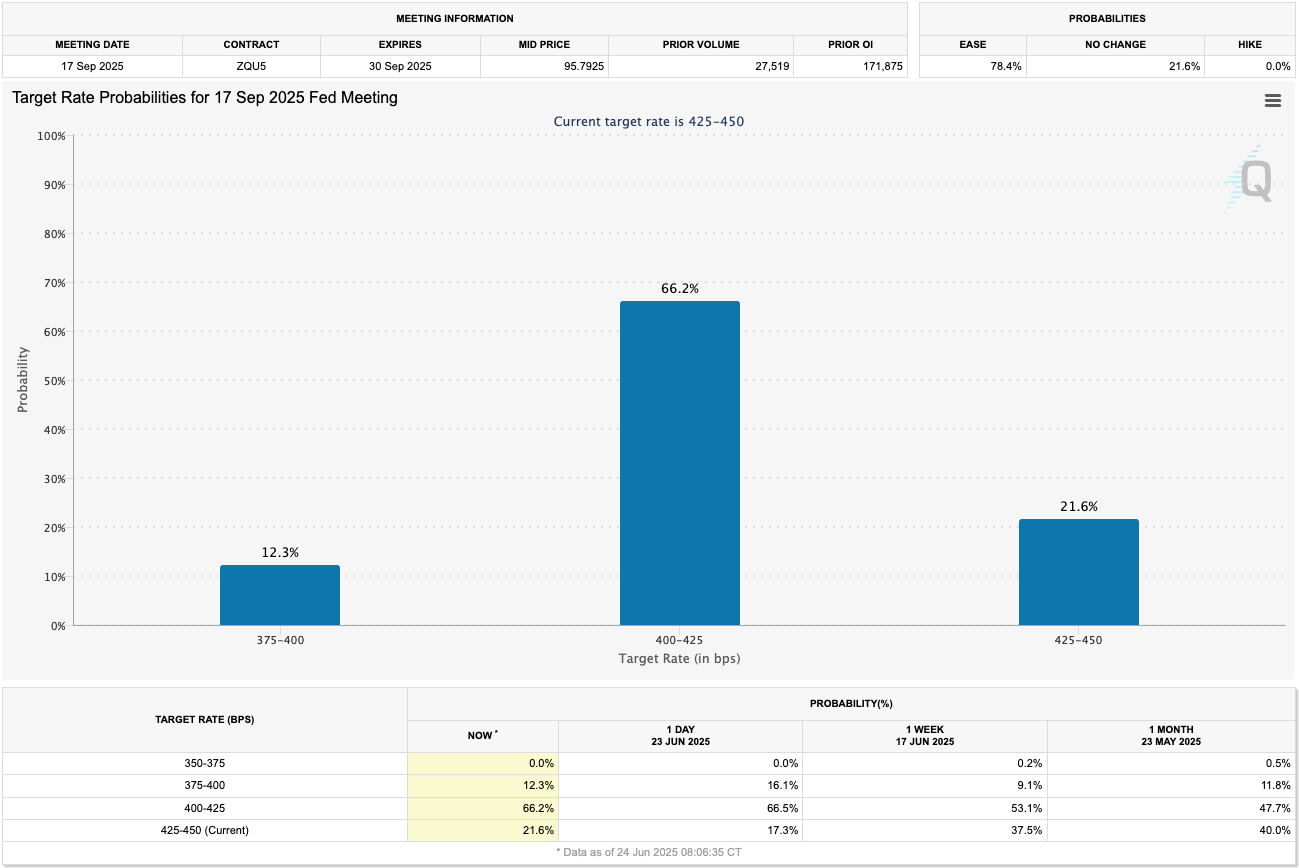
Recent Fed commentary—especially from Trump appointees Bowman and Waller—has markets anticipating an imminent policy pivot. Both suggested rate cuts could arrive as soon as July, but odds remain just 16.5% for action at the 30th July meeting, with market conviction building for a September (67.6% odds) or October cut instead.
Friday’s PCE inflation print will be a decisive checkpoint for the bond and risk asset rally. Sustained dovish Fed rhetoric, against a backdrop of softening labour data, could set the tone for the summer’s trend.
30th July FED Meeting – Odds of Rate Cut:
17th September FED Meeting – Odds of Rate Cut:
Cryptonary’s base case: Cuts likely by September or October, but sticky inflation—possibly driven by tariff impact—could delay the timeline.
Crypto majors slam into resistance across the board
Ceasefire euphoria sparked a rally in all major cryptos, but charts now show formidable resistance ceilings everywhere:
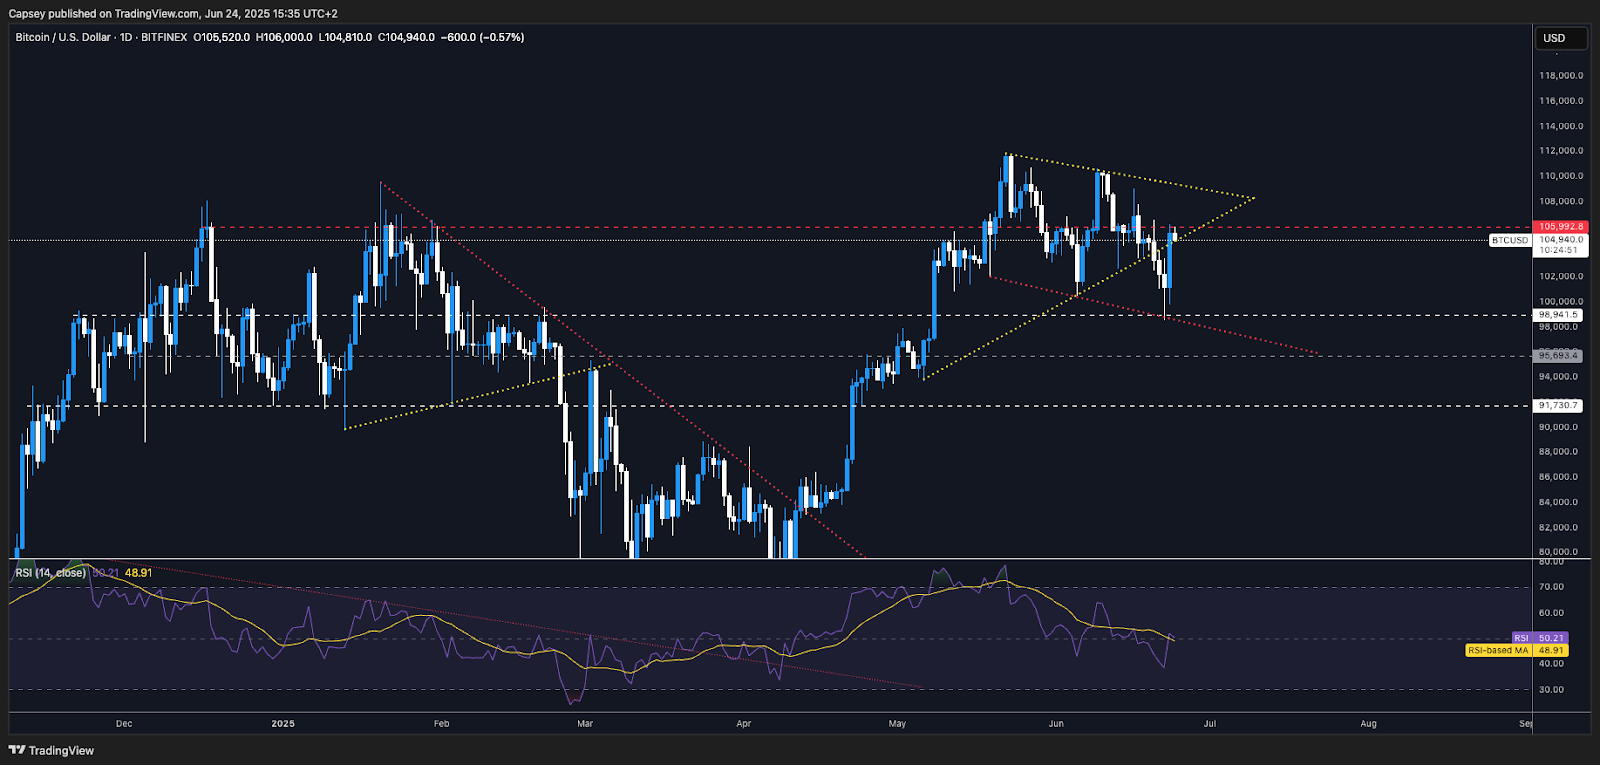
BTC 1D timeframe – $105,500 resistance:
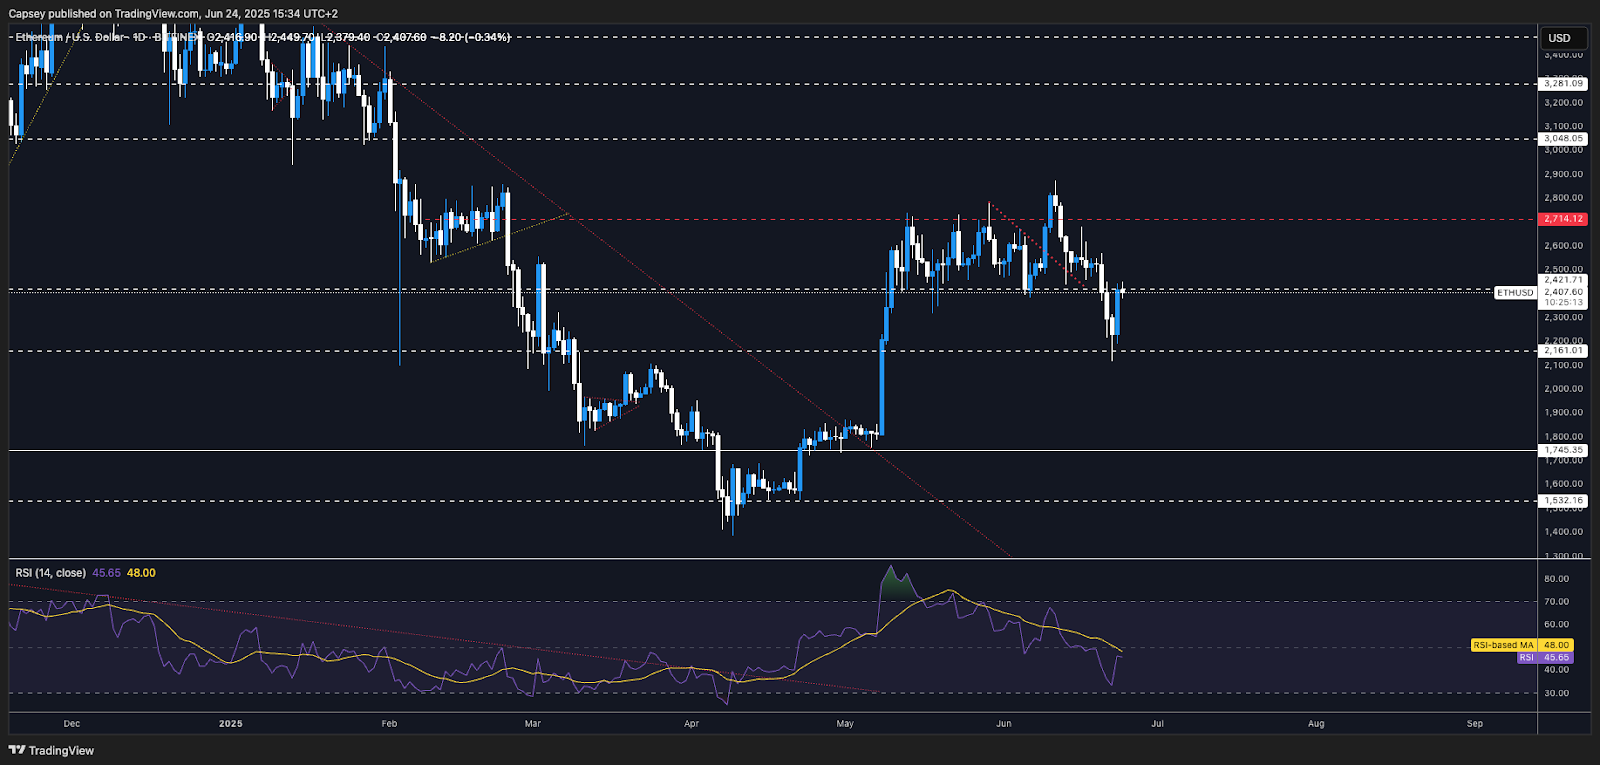
ETH 1D timeframe – $2,420 resistance:
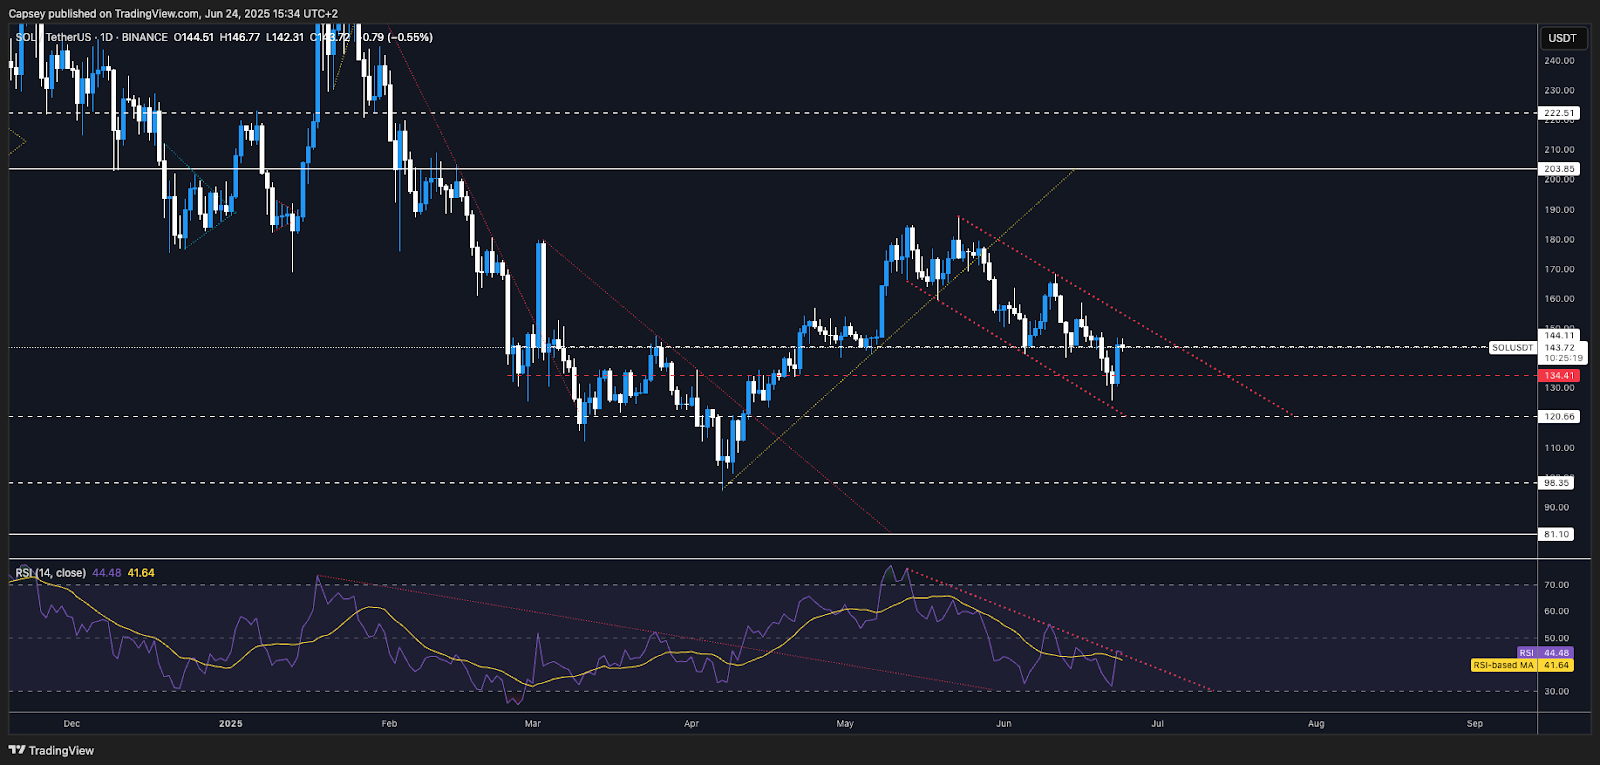
SOL 1D timeframe – $144 resistance:
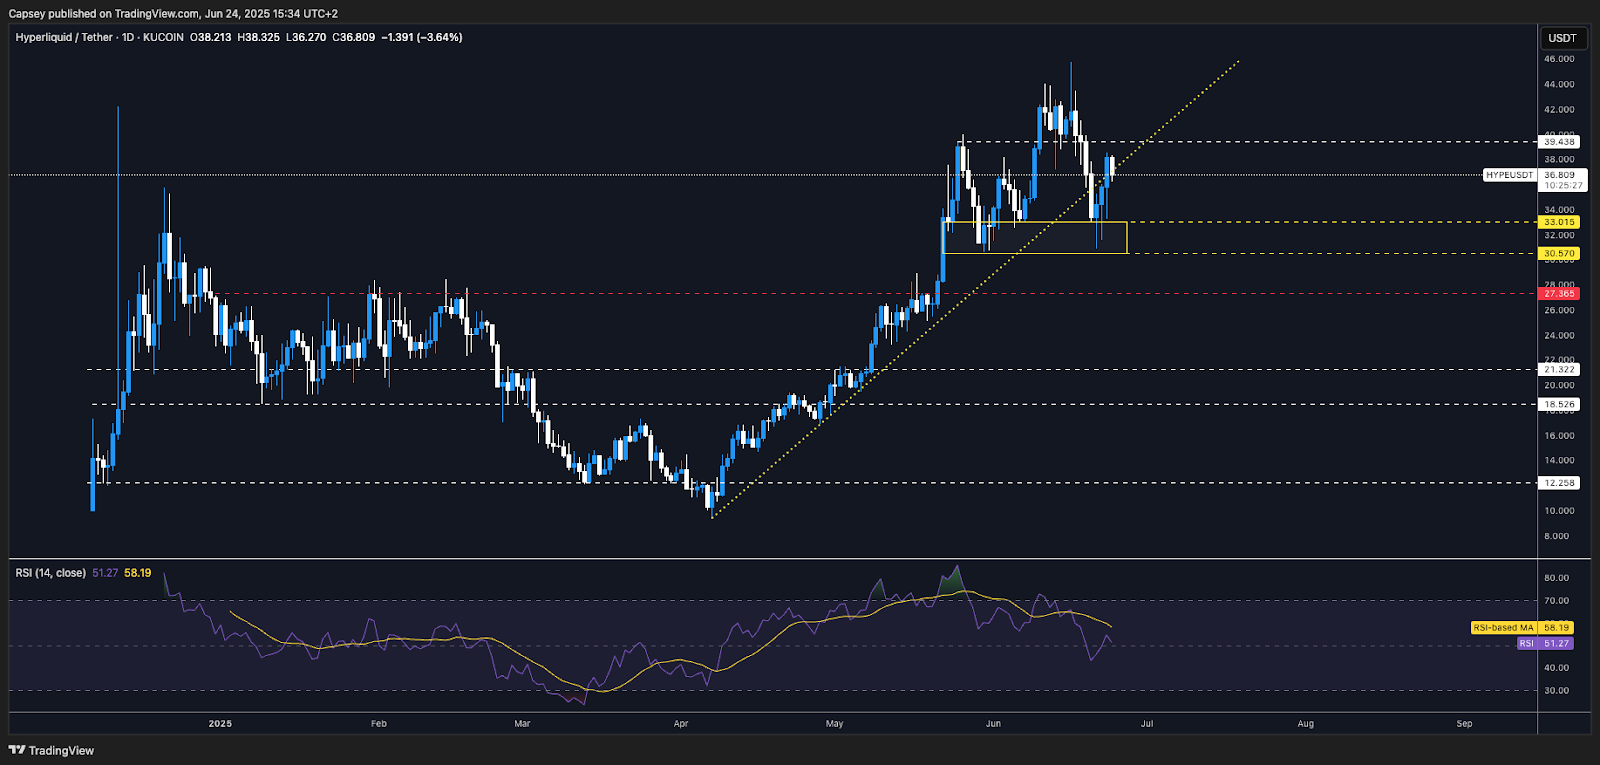
HYPE 1D timeframe – just below $39.40 resistance:
With risk appetite high and price crowded at these levels, a period of chop or staged pullback is likely—unless macro catalysts push a clear breakout.
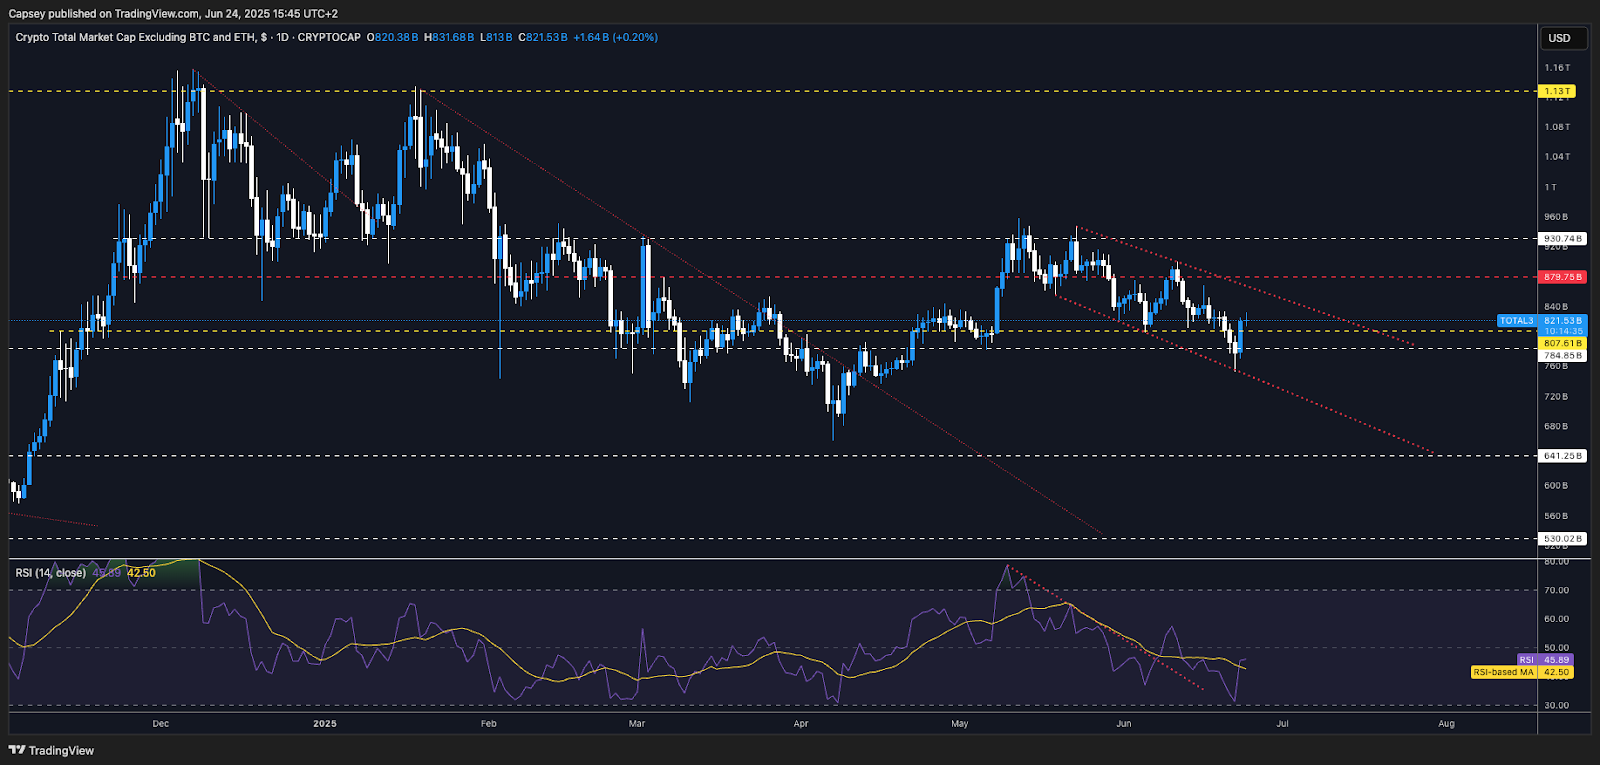
Altcoins (TOTAL3) have also rebounded, reclaiming support at $784b and $807b, yet remain boxed inside a downtrend channel—a bullish setup if $784b holds and a breakout through the trend line is achieved.
TOTAL3 1D timeframe:
ETF inflows: Bulls need new conviction
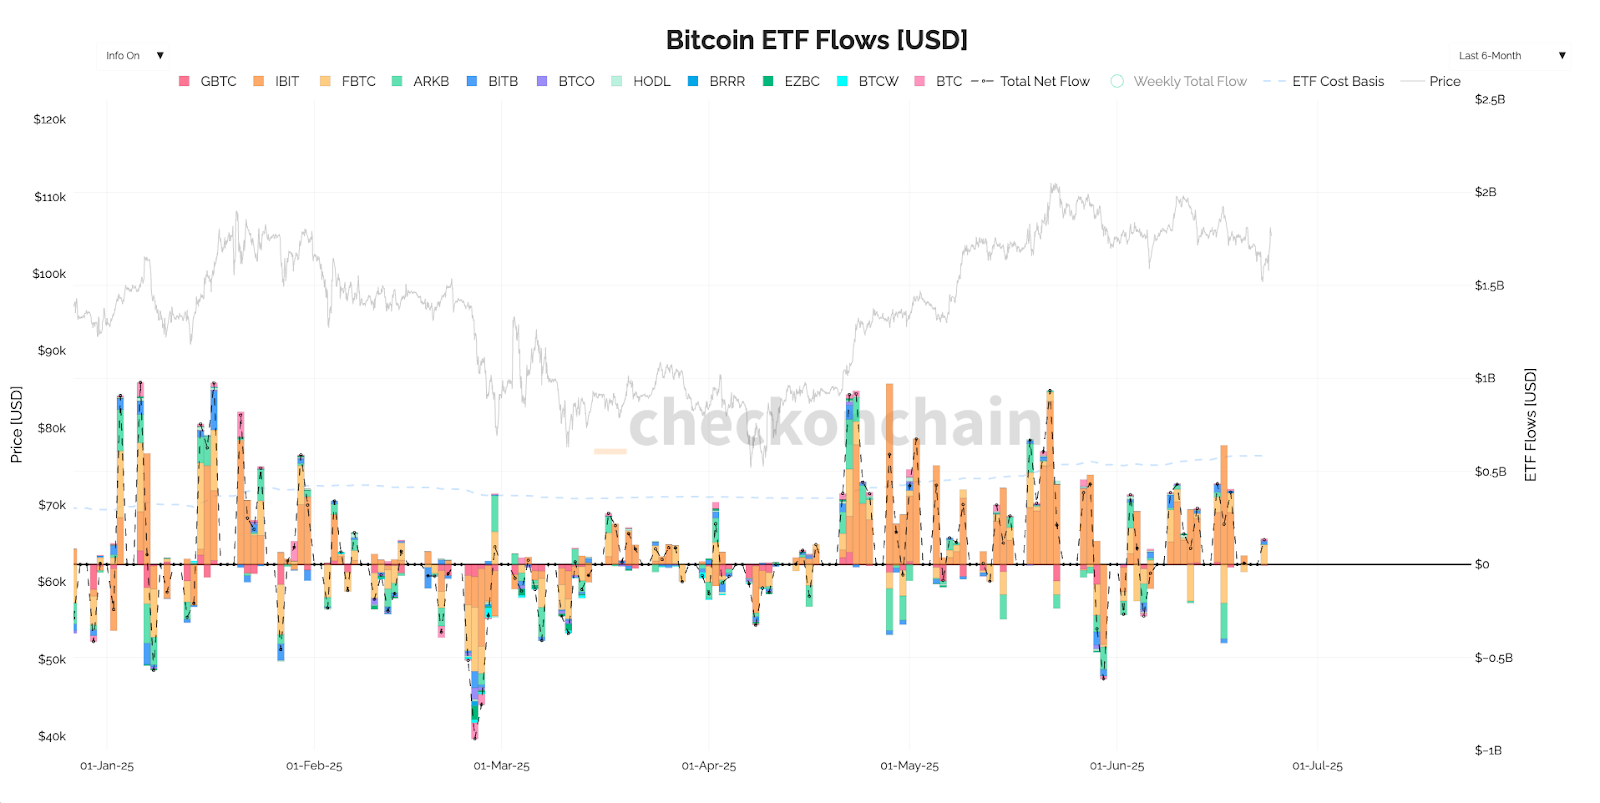
Despite the turbulence, Bitcoin ETF flows have held positive. Flow paused briefly during peak conflict but stabilised as ceasefire news landed. Now, ETF inflows remain the critical sentiment barometer. Risk: if flows fade and resistance holds, this rally could be quickly rolled back.
BTC ETF Inflows:
Cryptonary’s take: Summer is for accumulation, not euphoria
Volatility around Middle East conflict produced opportunity—entries at $125-$130 (SOL) and $2,160 (ETH) proved timely. Cryptonary sees the current period as a time to build positions on meaningful pullbacks, expecting policy-driven upside in Q4 2025 (or sooner if data corroborates).
With majors at resistance and macro risk in flux, patience is key—accumulation beats chasing breakouts. Plan: steady, informed buys on dips, ready for a Q4 macro inflection.
Conclusion: Cautious optimism beats FOMO as summer unfolds
Ceasefire-driven bullishness and dovish Fed hopes have lifted markets, but resistance levels and lingering risks demand discipline. If new data or ETF flows reignite momentum, major breakouts are possible—but for now, strategic accumulation remains the edge. As always, let the charts—and the macro—lead your next move.